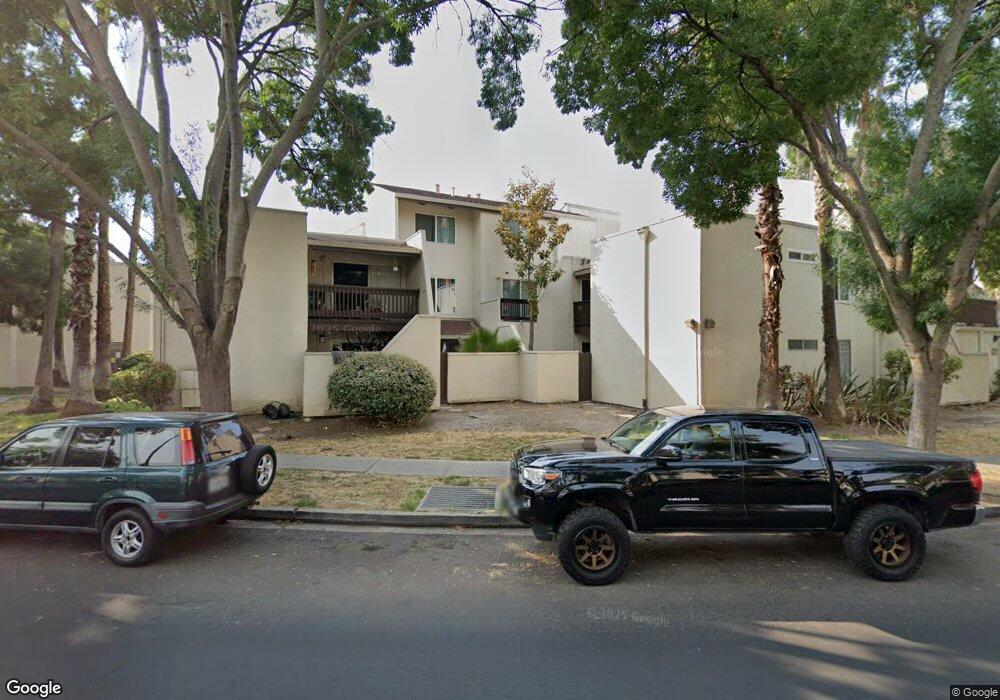
1700 Laguna St Unit H Concord, CA 94520
Islandis NeighborhoodEstimated Value: $343,000 - $450,000
3
Beds
2
Baths
1,270
Sq Ft
$299/Sq Ft
Est. Value
About This Home
This home is located at 1700 Laguna St Unit H, Concord, CA 94520 and is currently estimated at $379,874, approximately $299 per square foot. 1700 Laguna St Unit H is a home located in Contra Costa County with nearby schools including Meadow Homes Elementary School, Oak Grove Middle School, and Mt. Diablo High School.
Ownership History
Date
Name
Owned For
Owner Type
Purchase Details
Closed on
Oct 3, 2000
Sold by
Hud
Bought by
Byrd Rebecca L
Current Estimated Value
Home Financials for this Owner
Home Financials are based on the most recent Mortgage that was taken out on this home.
Original Mortgage
$140,125
Outstanding Balance
$51,394
Interest Rate
8%
Mortgage Type
Purchase Money Mortgage
Estimated Equity
$328,480
Purchase Details
Closed on
Jan 5, 2000
Sold by
Fichtner Robin C and Fichtner Lavern Terry
Bought by
First Nationwide Mtg Corp
Purchase Details
Closed on
Oct 14, 1996
Sold by
Rosenquist Mary M
Bought by
Fichtner Robin C and Lavern Terry G
Home Financials for this Owner
Home Financials are based on the most recent Mortgage that was taken out on this home.
Original Mortgage
$82,100
Interest Rate
8.37%
Mortgage Type
FHA
Create a Home Valuation Report for This Property
The Home Valuation Report is an in-depth analysis detailing your home's value as well as a comparison with similar homes in the area
Home Values in the Area
Average Home Value in this Area
Purchase History
| Date | Buyer | Sale Price | Title Company |
|---|---|---|---|
| Byrd Rebecca L | $147,500 | North American Title Co | |
| First Nationwide Mtg Corp | $90,011 | Fidelity National Title Ins | |
| Hud | -- | Fidelity National Title | |
| Fichtner Robin C | $84,000 | First American Title Guarant |
Source: Public Records
Mortgage History
| Date | Status | Borrower | Loan Amount |
|---|---|---|---|
| Open | Byrd Rebecca L | $140,125 | |
| Previous Owner | Fichtner Robin C | $82,100 |
Source: Public Records
Tax History Compared to Growth
Tax History
| Year | Tax Paid | Tax Assessment Tax Assessment Total Assessment is a certain percentage of the fair market value that is determined by local assessors to be the total taxable value of land and additions on the property. | Land | Improvement |
|---|---|---|---|---|
| 2025 | $3,343 | $222,239 | $31,255 | $190,984 |
| 2024 | $3,262 | $217,883 | $30,643 | $187,240 |
| 2023 | $3,262 | $213,612 | $30,043 | $183,569 |
| 2022 | $3,197 | $209,424 | $29,454 | $179,970 |
| 2021 | $3,104 | $205,319 | $28,877 | $176,442 |
| 2019 | $3,031 | $199,230 | $28,021 | $171,209 |
| 2018 | $2,905 | $195,324 | $27,472 | $167,852 |
| 2017 | $2,795 | $191,495 | $26,934 | $164,561 |
| 2016 | $2,694 | $187,741 | $26,406 | $161,335 |
| 2015 | $2,636 | $184,922 | $26,010 | $158,912 |
| 2014 | $2,236 | $152,000 | $21,380 | $130,620 |
Source: Public Records
Map
Nearby Homes
- 1699 Laguna St Unit 302
- 1699 Laguna St Unit 311
- 2100 Laguna Cir Unit D
- 1591 Ellis St Unit 307
- 1520 Detroit Ave
- 1731 Ellis St Unit 16
- 1867 Toyon Dr
- 2722 Cowell Rd
- 1385 Galindo St
- 2450 Walters Way Unit 27
- 2450 Walters Way Unit 11
- 2450 Walters Way Unit 2
- 1771 Broadway St Unit 106
- 1771 Broadway St Unit 213
- 1312 Tapestry Ln
- 1851 Harrison St Unit 15
- 2170 Fremont St
- 2860 Laguna St
- 2093 Mount Diablo St
- 2941 Crawford St
- 1700 Laguna St
- 1700 Laguna St Unit G
- 1700 Laguna St Unit F
- 1700 Laguna St Unit E
- 1700 Laguna St Unit D
- 1700 Laguna St Unit C
- 1700 Laguna St Unit A
- 1720 Laguna St Unit G
- 1720 Laguna St Unit F
- 1720 Laguna St Unit E
- 1720 Laguna St Unit D
- 1720 Laguna St Unit C
- 1720 Laguna St Unit B
- 1720 Laguna St Unit A
- 1720 Laguna St Unit H
- 1680 Laguna St
- 1680 Laguna St Unit H
- 1680 Laguna St Unit G
- 1680 Laguna St Unit F
- 1680 Laguna St Unit E