1700 N 9th St Clinton, IN 47842
Estimated Value: $153,000 - $239,000
Studio
2
Baths
2,242
Sq Ft
$83/Sq Ft
Est. Value
About This Home
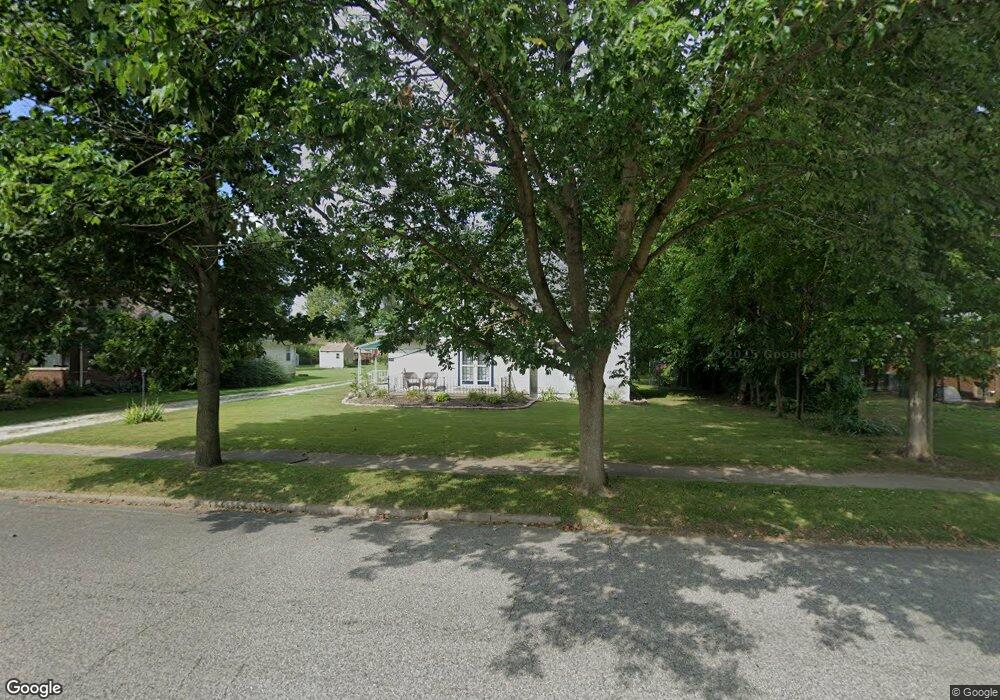
This home is located at 1700 N 9th St, Clinton, IN 47842 and is currently estimated at $186,556, approximately $83 per square foot. 1700 N 9th St is a home located in Vermillion County with nearby schools including South Vermillion High School and Sacred Heart School.
Ownership History
Date
Name
Owned For
Owner Type
Purchase Details
Closed on
Mar 26, 2021
Sold by
Mckeag Ruth Ann and Mcmahan Angela D
Bought by
Hannum Benjamin E and Hannum Holly S
Current Estimated Value
Home Financials for this Owner
Home Financials are based on the most recent Mortgage that was taken out on this home.
Original Mortgage
$10,000
Outstanding Balance
$8,915
Interest Rate
2.9%
Mortgage Type
New Conventional
Estimated Equity
$177,641
Purchase Details
Closed on
Aug 24, 2018
Sold by
David
Bought by
Ann Mckeag Ruth
Purchase Details
Closed on
Nov 13, 2013
Sold by
Pierce Michael W and Pierce Karen N
Bought by
Robinson David J and Robinson Kristin M
Create a Home Valuation Report for This Property
The Home Valuation Report is an in-depth analysis detailing your home's value as well as a comparison with similar homes in the area
Purchase History
| Date | Buyer | Sale Price | Title Company |
|---|---|---|---|
| Hannum Benjamin E | -- | Integrity Title Services | |
| Ann Mckeag Ruth | $130,000 | -- | |
| Mckeag Ruth Ann | $130,000 | Aames Title & Closing | |
| Robinson David J | $108,000 | Honey Creek Title Services | |
| David J | $108,000 | Honey Creek Title Services |
Source: Public Records
Mortgage History
| Date | Status | Borrower | Loan Amount |
|---|---|---|---|
| Open | Hannum Benjamin E | $10,000 |
Source: Public Records
Tax History
| Year | Tax Paid | Tax Assessment Tax Assessment Total Assessment is a certain percentage of the fair market value that is determined by local assessors to be the total taxable value of land and additions on the property. | Land | Improvement |
|---|---|---|---|---|
| 2025 | $975 | $126,400 | $28,500 | $97,900 |
| 2024 | $975 | $107,500 | $28,500 | $79,000 |
| 2023 | $1,022 | $107,500 | $28,500 | $79,000 |
| 2022 | $1,068 | $108,300 | $28,500 | $79,800 |
| 2021 | $905 | $97,000 | $28,500 | $68,500 |
| 2020 | $659 | $83,100 | $20,700 | $62,400 |
| 2019 | $658 | $83,100 | $20,700 | $62,400 |
| 2018 | $581 | $79,100 | $22,700 | $56,400 |
| 2017 | $475 | $75,300 | $22,700 | $52,600 |
| 2016 | $476 | $75,300 | $22,700 | $52,600 |
| 2014 | $414 | $68,200 | $22,700 | $45,500 |
| 2013 | $414 | $68,200 | $22,700 | $45,500 |
Source: Public Records
Map
Nearby Homes
Your Personal Tour Guide
Ask me questions while you tour the home.