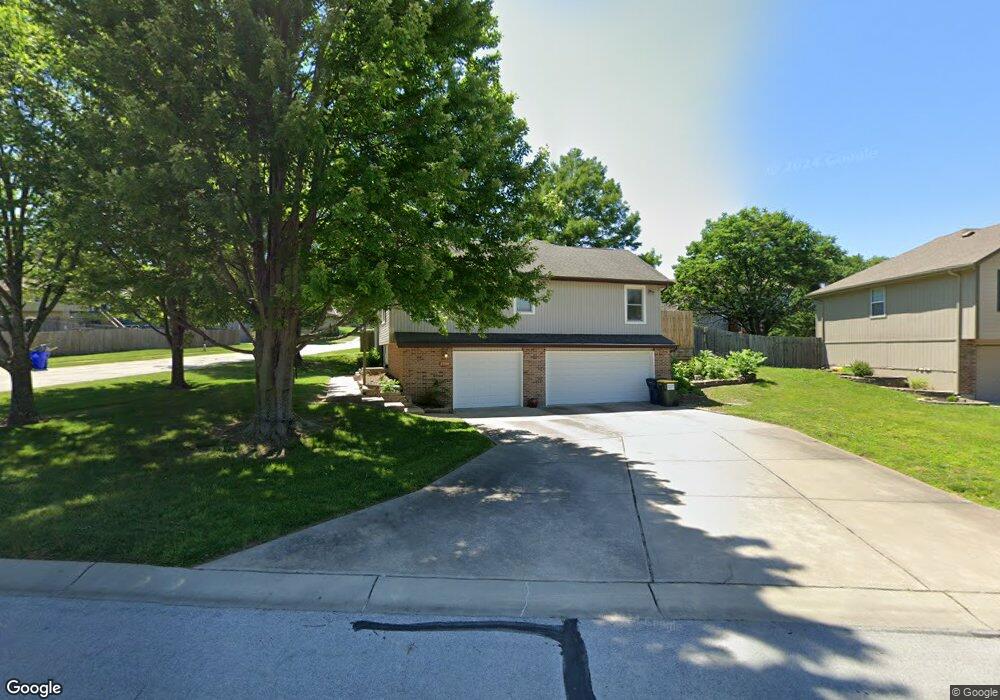
1700 NE Stonewood Dr Lees Summit, MO 64086
Estimated Value: $344,146 - $395,000
3
Beds
3
Baths
1,656
Sq Ft
$224/Sq Ft
Est. Value
About This Home
This home is located at 1700 NE Stonewood Dr, Lees Summit, MO 64086 and is currently estimated at $370,787, approximately $223 per square foot. 1700 NE Stonewood Dr is a home located in Jackson County with nearby schools including Underwood Elementary School, Bernard C. Campbell Middle School, and Lee's Summit North High School.
Ownership History
Date
Name
Owned For
Owner Type
Purchase Details
Closed on
Dec 6, 2019
Sold by
Freiwald Michael Larry
Bought by
Freiwald Michael Larry and Freiwald Amy L
Current Estimated Value
Home Financials for this Owner
Home Financials are based on the most recent Mortgage that was taken out on this home.
Original Mortgage
$181,000
Outstanding Balance
$159,578
Interest Rate
3.6%
Mortgage Type
VA
Estimated Equity
$211,209
Purchase Details
Closed on
Oct 5, 2011
Sold by
Seever Jeffrey P and Seever Elaine M
Bought by
Freiwald Michael Larry
Home Financials for this Owner
Home Financials are based on the most recent Mortgage that was taken out on this home.
Original Mortgage
$165,250
Interest Rate
4.28%
Mortgage Type
VA
Purchase Details
Closed on
Nov 1, 1995
Sold by
Ong Building Corp
Bought by
Seever Jeffrey P and Seever Elaine M
Create a Home Valuation Report for This Property
The Home Valuation Report is an in-depth analysis detailing your home's value as well as a comparison with similar homes in the area
Home Values in the Area
Average Home Value in this Area
Purchase History
| Date | Buyer | Sale Price | Title Company |
|---|---|---|---|
| Freiwald Michael Larry | -- | None Available | |
| Freiwald Michael Larry | -- | Kansas City Title Inc | |
| Seever Jeffrey P | -- | Chicago Title Insurance Co |
Source: Public Records
Mortgage History
| Date | Status | Borrower | Loan Amount |
|---|---|---|---|
| Open | Freiwald Michael Larry | $181,000 | |
| Closed | Freiwald Michael Larry | $165,250 |
Source: Public Records
Tax History
| Year | Tax Paid | Tax Assessment Tax Assessment Total Assessment is a certain percentage of the fair market value that is determined by local assessors to be the total taxable value of land and additions on the property. | Land | Improvement |
|---|---|---|---|---|
| 2025 | $3,865 | $54,023 | $7,750 | $46,273 |
| 2024 | $3,837 | $53,529 | $6,468 | $47,061 |
| 2023 | $3,837 | $53,529 | $6,171 | $47,358 |
| 2022 | $3,298 | $40,850 | $5,531 | $35,319 |
| 2021 | $3,366 | $40,850 | $5,531 | $35,319 |
| 2020 | $3,238 | $38,916 | $5,531 | $33,385 |
| 2019 | $3,150 | $38,916 | $5,531 | $33,385 |
| 2018 | $985,083 | $33,869 | $4,814 | $29,055 |
| 2016 | $2,828 | $32,091 | $4,256 | $27,835 |
Source: Public Records
Map
Nearby Homes
- 1717 NE Luther Rd
- 1541 NE Neawanna Dr
- 1133 NE Mulberry St
- 1141 NE Hunters Ridge
- 1118 NE Deerbrook Terrace
- 1676 NE Ozark Dr
- 1104 NE Country Ln
- 1213 NE Ball Dr
- 1616 NE Bluff St
- 1700 NE Bluff St
- 1708 NE Bluff St
- 1704 NE Bluff St
- 1029 NE Brookfield Dr
- 1028 NE Brookfield Dr
- 816 NE Pollard St
- 13511 Woodland Ranch Dr
- 13311 Woodland Ranch Dr
- 13507 Woodland Ranch Dr
- 812 NE Mulberry St
- 809 NE Cedar St
- 1704 NE Stonewood Dr
- 1701 NE Stonewood Dr
- 1705 NE Stonewood Dr
- 1701 NE Whitestone Dr
- 1633 NE Stonewood Dr
- 1709 NE Stonewood Dr
- 1705 NE Whitestone Dr
- 1628 NE Stonewood Dr
- 1712 NE Stonewood Dr
- 1633 NE Whitestone Dr
- 1709 NE Whitestone Dr
- 1629 NE Stonewood Dr
- 1713 NE Stonewood Dr
- 1624 NE Stonewood Dr
- 1704 NE Whitestone Dr
- 1713 NE Whitestone Dr
- 1716 NE Stonewood Dr
- 1625 NE Stonewood Dr
- 1708 NE Whitestone Dr
- 1717 NE Stonewood Dr
Your Personal Tour Guide
Ask me questions while you tour the home.