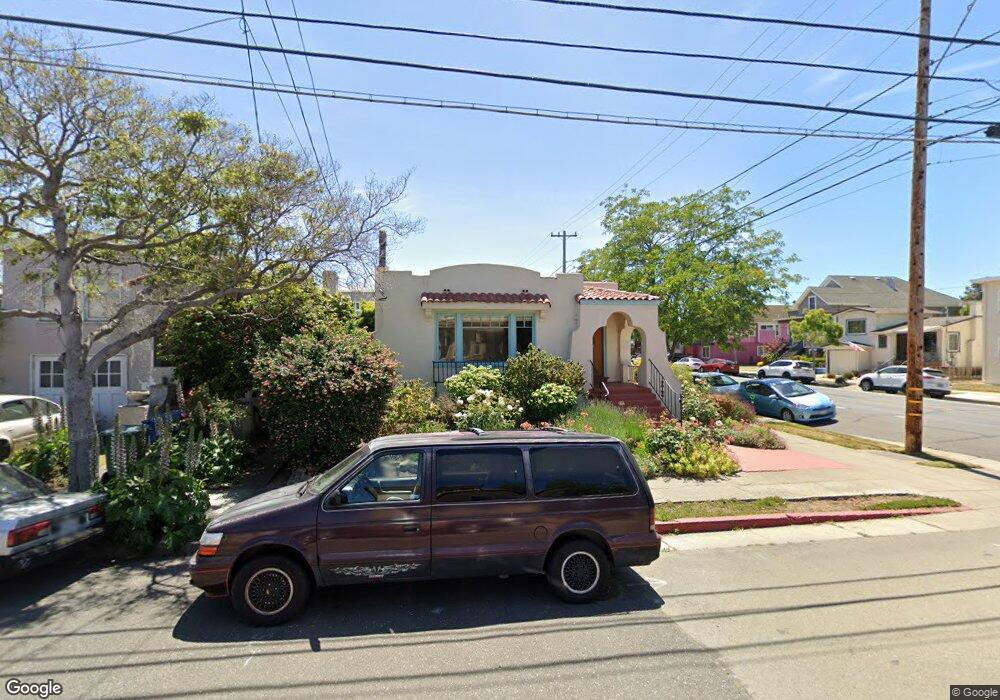
1700 Pacific Ave Alameda, CA 94501
West Alameda NeighborhoodEstimated Value: $872,132 - $1,038,000
2
Beds
1
Bath
1,258
Sq Ft
$757/Sq Ft
Est. Value
About This Home
This home is located at 1700 Pacific Ave, Alameda, CA 94501 and is currently estimated at $952,033, approximately $756 per square foot. 1700 Pacific Ave is a home located in Alameda County with nearby schools including Maya Lin School, Will C. Wood Middle School, and Encinal Junior/Senior High.
Ownership History
Date
Name
Owned For
Owner Type
Purchase Details
Closed on
Dec 15, 2017
Sold by
Neuhoff Sarah Virginia
Bought by
Neuhoff Sarah Virginia and The Sarah Virginia Neuhoff Liv
Current Estimated Value
Purchase Details
Closed on
Oct 30, 2002
Sold by
Viveiros Joe J
Bought by
Viveiros Joe J and Viveiros Connie
Home Financials for this Owner
Home Financials are based on the most recent Mortgage that was taken out on this home.
Original Mortgage
$100,000
Outstanding Balance
$41,793
Interest Rate
5.99%
Mortgage Type
Credit Line Revolving
Estimated Equity
$910,240
Purchase Details
Closed on
Mar 20, 1997
Sold by
Collins Leo B and Collins Lloydine E
Bought by
Neuhoff Sarah Virginia
Home Financials for this Owner
Home Financials are based on the most recent Mortgage that was taken out on this home.
Original Mortgage
$144,400
Interest Rate
7.74%
Purchase Details
Closed on
Aug 2, 1994
Sold by
Collins Lloydine E
Bought by
Collins Leo B and Collins Lloydine E
Create a Home Valuation Report for This Property
The Home Valuation Report is an in-depth analysis detailing your home's value as well as a comparison with similar homes in the area
Home Values in the Area
Average Home Value in this Area
Purchase History
| Date | Buyer | Sale Price | Title Company |
|---|---|---|---|
| Neuhoff Sarah Virginia | -- | None Available | |
| Viveiros Joe J | -- | -- | |
| Neuhoff Sarah Virginia | $180,500 | Old Republic Title Company | |
| Collins Leo B | -- | -- |
Source: Public Records
Mortgage History
| Date | Status | Borrower | Loan Amount |
|---|---|---|---|
| Open | Viveiros Joe J | $100,000 | |
| Closed | Neuhoff Sarah Virginia | $144,400 |
Source: Public Records
Tax History
| Year | Tax Paid | Tax Assessment Tax Assessment Total Assessment is a certain percentage of the fair market value that is determined by local assessors to be the total taxable value of land and additions on the property. | Land | Improvement |
|---|---|---|---|---|
| 2025 | $5,351 | $290,306 | $88,269 | $209,037 |
| 2024 | $5,351 | $284,477 | $86,538 | $204,939 |
| 2023 | $5,173 | $285,763 | $84,842 | $200,921 |
| 2022 | $5,065 | $273,161 | $83,179 | $196,982 |
| 2021 | $4,955 | $267,668 | $81,548 | $193,120 |
| 2020 | $4,897 | $271,852 | $80,712 | $191,140 |
| 2019 | $4,492 | $266,524 | $79,130 | $187,394 |
| 2018 | $4,354 | $258,358 | $77,579 | $180,779 |
| 2017 | $4,182 | $253,293 | $76,058 | $177,235 |
| 2016 | $4,169 | $248,328 | $74,567 | $173,761 |
| 2015 | $4,150 | $244,598 | $73,447 | $171,151 |
| 2014 | $3,990 | $239,808 | $72,009 | $167,799 |
Source: Public Records
Map
Nearby Homes
- 1707 Lincoln Ave
- 1604 Schiller St
- 1813 Minturn St
- 1726 Eagle Ave
- 1821 Grand St
- 1921 Grand St
- 1925 Grand St
- 1933 Grand St
- 1670 Larkspur St
- 1937 Grand St
- 1668 Clement Ave
- 1401 Cottage St Unit D
- 610 Grand St
- 1211 Paru St
- 1500 Alameda Ave Unit G
- 2025 Stanford St
- 1203 Benton St
- 1606 Morton St
- 2050 Central Ave
- 2053 Clement Ave
- 1702 Pacific Ave
- 1620 Grand St
- 1704 Pacific Ave
- 1618 Grand St
- 1708 Pacific Ave
- 1629 Grand St
- 1701 Pacific Ave
- 1612 Grand St
- 1705 Pacific Ave
- 1712 Pacific Ave
- 1619 Grand St
- 1615 Grand St
- 1632 Pacific Ave
- 1714 Pacific Ave
- 1708 Grand St
- 1709 Pacific Ave Unit B
- 1709 Pacific Ave
- 1611 Minturn St
- 1703 Grand St
- 1607 Grand St
Your Personal Tour Guide
Ask me questions while you tour the home.