NOT LISTED FOR SALE

Estimated Value: $411,761 - $468,000

4 Beds
2 Baths
1,959 Sq Ft
$228/Sq Ft Est. Value

Last Sold November 28, 2017

Last sale price $193,000 $99 Per Sq Ft

Est. 131% increase in value since last sale

Current estimated payment $2,615/month

About This Home

As of November 2017

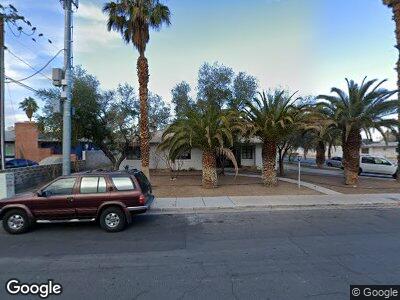
Renovated Single story> Fresh Paint >New Quartz Countertops> New Laminate Flooring.

Ownership History

Date Name Owned For Owner Type

Purchase Details

Closed on
Apr 5, 2021
Sold by
Ben Avi Deborah Yael
Bought by
Mizrahi Isaac
Current Estimated Value
$446,190

Home Financials for this Owner

Home Financials are based on the most recent Mortgage that was taken out on this home.
Original Mortgage
$222,000
Outstanding Balance
$202,302
Interest Rate
2.9%
Mortgage Type
New Conventional
Estimated Equity
$243,888

Purchase Details

Listed on
Oct 30, 2017
Closed on
Nov 28, 2017
Sold by
Ppk Llc
Bought by
Shemont Tevel Llc
Seller's Agent
Sherri Simhayoff-Cohen
Wardley Real Estate
Buyer's Agent
Sherri Simhayoff-Cohen
Wardley Real Estate
List Price
$200,000
Sold Price
$193,000
Premium/Discount to List
-$7,000
-3.5%

Home Financials for this Owner

Home Financials are based on the most recent Mortgage that was taken out on this home.
Avg. Annual Appreciation
11.84%

Purchase Details

Closed on
Mar 10, 2015
Sold by
Kelesis Paula
Bought by
Ppk Llc

Purchase Details

Closed on
Nov 14, 2014
Sold by
Kelesis George P and Kelesis Paula
Bought by
Kelesis Paula

Range of Values:

Collateral Analytics

Collateral Analytics Collateral Analytics AVMs (Automated Valuation Model) employ a number of statistical approaches combined with neighborhood-specific comparable selection guarantees the most up-to-date and precise valuations.

Not Available

Collateral Analytics does not have data for the current month. Please view the chart for historical values.

ICE

ICE Mortgage Technology ICE Mortgage Technology’s AVM (Automated Valuation Model) is a state-of-the-art online residential property valuation tool that provides a quick and accurate estimate of the value of almost any home in the U.S.

Not Available

ICE Mortgage Technology does not have data for the current month. Please view the chart for historical values.

First American

First American First American Data & Analytics’ next-generation AVM combines unrivaled data assets with a blended ensemble of valuation models to produce highly accurate, reliable valuations you can trust.

Not Available

First American does not have data for the current month. Please view the chart for historical values.

Quantarium

Quantarium Quantarium’s valuation service, repeatedly proven the industry’s most accurate and comprehensive, is supercharged with a self-learning and auto-tuning AI engine that continually becomes smarter and more accurate as it processes daily inputs from the industry’s leading RE data lake.

Not Available

Quantarium does not have data for the current month. Please view the chart for historical values.

Average Value
Not Available
List Price
Sold Price
Create a Home Valuation Report for This Property
The Home Valuation Report is an in-depth analysis detailing your home's value as well as a comparison with similar homes in the area

Home Values in the Area

Source: Public Records

Average Home Value in this Area


Source: Public Records

Purchase History

Date Buyer Sale Price Title Company
Mizrahi Isaac -- Ticor Title Las Vegas Sum
Mizrahi Isaac $296,000 Ticor Title Las Vegas Sum
Shemont Tevel Llc -- None Available
Ppk Llc -- None Available
Kelesis Paula -- None Available
Source: Public Records

Mortgage History

Date Status Borrower Loan Amount
Open Mizrahi Isaac $222,000
Source: Public Records

Property History

Date Event Price Change Sq Ft Price
07/04/2018 07/04/18 Rented $1,665 0.0% --
06/04/2018 06/04/18 Under Contract -- -- --
05/18/2018 05/18/18 For Rent $1,665 0.0% --
11/28/2017 11/28/17 Sold $193,000 -3.5% $99 / Sq Ft
10/30/2017 10/30/17 For Sale $200,000 -- $102 / Sq Ft

Tax History Compared to Growth

Source: Public Records

Tax History

Year Tax Paid Tax Assessment Tax Assessment Total Assessment is a certain percentage of the fair market value that is determined by local assessors to be the total taxable value of land and additions on the property. Land Improvement
2025 $1,411 $66,299 $36,400 $29,899
2024 $1,307 $66,299 $36,400 $29,899
2023 $1,307 $69,304 $42,350 $26,954
2022 $1,211 $54,264 $30,100 $24,164
2021 $1,121 $52,265 $29,750 $22,515
2020 $1,038 $52,956 $31,150 $21,806
2019 $973 $46,611 $25,550 $21,061
2018 $929 $42,568 $22,750 $19,818
2017 $1,253 $38,214 $18,550 $19,664
2016 $870 $33,662 $14,700 $18,962
2015 $867 $30,620 $12,250 $18,370
2014 $840 $25,329 $7,350 $17,979
Source: Public Records

Agents Affiliated with this Home

  • Section Image
  • Section Image
  • Section Image
See All Agents

Map