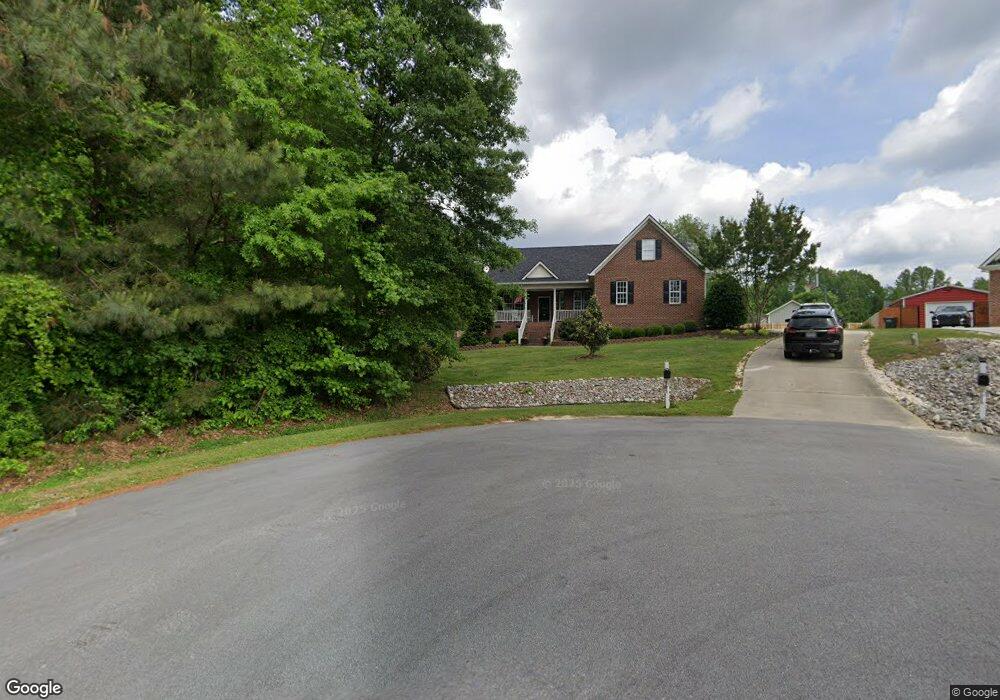
1700 Starfish Ct Willow Spring, NC 27592
Estimated Value: $417,000 - $460,602
3
Beds
2
Baths
1,559
Sq Ft
$285/Sq Ft
Est. Value
About This Home
This home is located at 1700 Starfish Ct, Willow Spring, NC 27592 and is currently estimated at $444,867, approximately $285 per square foot. 1700 Starfish Ct is a home located in Wake County with nearby schools including Willow Springs Elementary School.
Ownership History
Date
Name
Owned For
Owner Type
Purchase Details
Closed on
Aug 25, 2014
Sold by
Burdick Nathan L and Burdick Elizabeth R
Bought by
Sherrill William C
Current Estimated Value
Home Financials for this Owner
Home Financials are based on the most recent Mortgage that was taken out on this home.
Original Mortgage
$202,040
Outstanding Balance
$154,514
Interest Rate
4.19%
Mortgage Type
New Conventional
Estimated Equity
$290,353
Purchase Details
Closed on
Jul 18, 2006
Sold by
Raynor Builders Inc
Bought by
Burdick Nathan L and Burdick Elizabeth R
Home Financials for this Owner
Home Financials are based on the most recent Mortgage that was taken out on this home.
Original Mortgage
$18,800
Interest Rate
6.28%
Mortgage Type
Stand Alone Second
Create a Home Valuation Report for This Property
The Home Valuation Report is an in-depth analysis detailing your home's value as well as a comparison with similar homes in the area
Home Values in the Area
Average Home Value in this Area
Purchase History
| Date | Buyer | Sale Price | Title Company |
|---|---|---|---|
| Sherrill William C | $198,000 | Attorneys Title | |
| Burdick Nathan L | $188,000 | None Available |
Source: Public Records
Mortgage History
| Date | Status | Borrower | Loan Amount |
|---|---|---|---|
| Open | Sherrill William C | $202,040 | |
| Previous Owner | Burdick Nathan L | $18,800 | |
| Previous Owner | Burdick Nathan L | $150,400 |
Source: Public Records
Tax History
| Year | Tax Paid | Tax Assessment Tax Assessment Total Assessment is a certain percentage of the fair market value that is determined by local assessors to be the total taxable value of land and additions on the property. | Land | Improvement |
|---|---|---|---|---|
| 2025 | $2,853 | $442,886 | $90,000 | $352,886 |
| 2024 | $2,770 | $442,886 | $90,000 | $352,886 |
| 2023 | $2,314 | $294,185 | $28,000 | $266,185 |
| 2022 | $2,145 | $294,185 | $28,000 | $266,185 |
| 2021 | $2,087 | $294,185 | $28,000 | $266,185 |
| 2020 | $2,053 | $294,185 | $28,000 | $266,185 |
| 2019 | $2,050 | $248,556 | $35,000 | $213,556 |
| 2018 | $1,620 | $213,211 | $35,000 | $178,211 |
| 2017 | $1,512 | $209,911 | $35,000 | $174,911 |
| 2016 | $1,482 | $209,911 | $35,000 | $174,911 |
| 2015 | $1,437 | $203,989 | $28,000 | $175,989 |
| 2014 | -- | $203,989 | $28,000 | $175,989 |
Source: Public Records
Map
Nearby Homes
- 1617 Kendall Hill Rd
- 1962 Dapple Dr
- 7218 Cabernet Franc Dr
- 2416 Eddie Howard Rd
- 7308 Messenger Dr
- 2416 Whitset Place
- 7301 Ladora Dr
- 1401 Justin Oaks Ct
- 7101 Numa Cir
- 5215 Red Crimson Dr
- 8324 Yellow Aster Ct
- 8120 Purple Aster Dr
- 8340 Cannon Grove Dr
- 8316 Running Fern Way
- 0 Turner Fish Rd Unit 10130690
- 1305 White Spruce Dr
- 1433 White Spruce Dr
- 1133 Farmers Branch Rd
- 3748 Norman Blalock Rd
- 1000 Creek Front Ct
- 1701 Starfish Ct
- 1705 Starfish Ct
- 1708 Shell Cracker Dr
- 1712 Shell Cracker Dr
- 1716 Shell Cracker Dr
- 1704 Shell Cracker Dr
- 1709 Starfish Ct
- 1728 Shell Cracker Dr
- 1720 Shell Cracker Dr
- 1732 Shell Cracker Dr
- 1736 Shell Cracker Dr
- 1017 Shellfish Dr
- 1012 Shellfish Dr
- 1717 Shell Cracker Dr
- 12480 Old Stage Rd
- 1020 Shellfish Dr
- 1725 Shell Cracker Dr
- 1721 Shell Cracker Dr
- 1016 Shellfish Dr
- 1729 Shell Cracker Dr
Your Personal Tour Guide
Ask me questions while you tour the home.