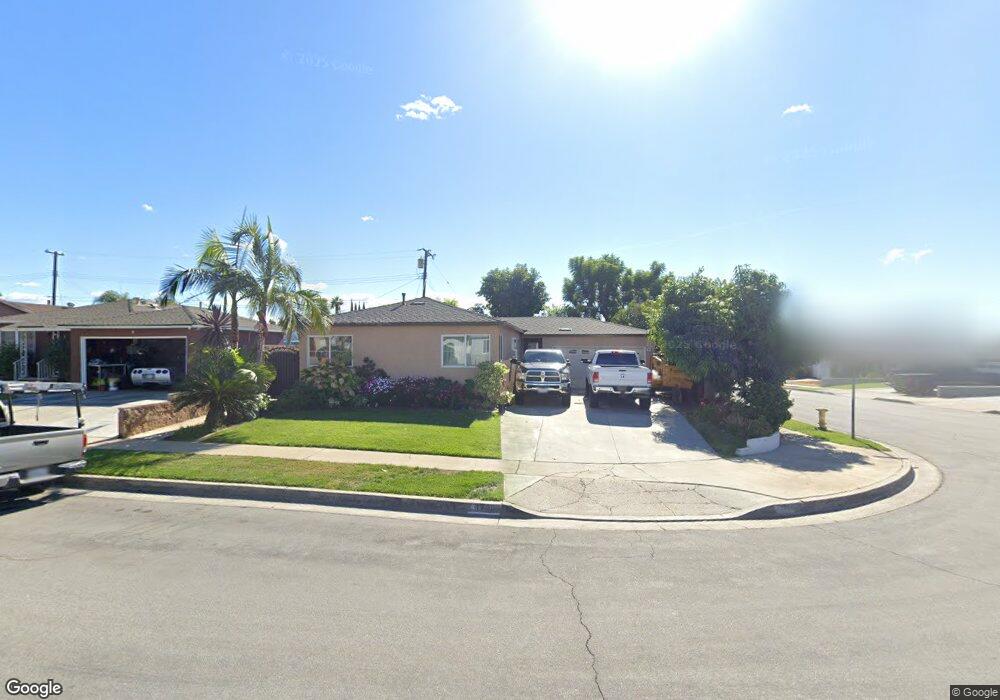
1700 Verdugo Ave La Habra, CA 90631
Estimated Value: $785,224 - $870,000
4
Beds
2
Baths
1,165
Sq Ft
$725/Sq Ft
Est. Value
About This Home
This home is located at 1700 Verdugo Ave, La Habra, CA 90631 and is currently estimated at $844,306, approximately $724 per square foot. 1700 Verdugo Ave is a home located in Orange County with nearby schools including Sierra Vista Elementary School, Ladera Palma Elementary School, and Washington Middle School.
Ownership History
Date
Name
Owned For
Owner Type
Purchase Details
Closed on
Aug 31, 2020
Sold by
Munoz Juan and Munoz Teresa
Bought by
Munoz Juan and Munoz Teresa
Current Estimated Value
Purchase Details
Closed on
Sep 26, 2002
Sold by
Munoz Juan G
Bought by
Munoz Juan and Munoz Teresa
Home Financials for this Owner
Home Financials are based on the most recent Mortgage that was taken out on this home.
Original Mortgage
$132,000
Interest Rate
6.09%
Purchase Details
Closed on
Oct 20, 1994
Sold by
Munoz Victor
Bought by
Munoz Juan and Munoz Teresa
Purchase Details
Closed on
Feb 2, 1994
Sold by
Clayton Scott F
Bought by
Munoz Juan and Munoz Teresa
Home Financials for this Owner
Home Financials are based on the most recent Mortgage that was taken out on this home.
Original Mortgage
$153,900
Interest Rate
7%
Create a Home Valuation Report for This Property
The Home Valuation Report is an in-depth analysis detailing your home's value as well as a comparison with similar homes in the area
Home Values in the Area
Average Home Value in this Area
Purchase History
| Date | Buyer | Sale Price | Title Company |
|---|---|---|---|
| Munoz Juan | -- | None Available | |
| Munoz Juan | -- | Chicago Title | |
| Munoz Juan | -- | Orange Coast Title Companies | |
| Munoz Juan | $162,000 | South Coast Title Company |
Source: Public Records
Mortgage History
| Date | Status | Borrower | Loan Amount |
|---|---|---|---|
| Closed | Munoz Juan | $132,000 | |
| Closed | Munoz Juan | $153,900 |
Source: Public Records
Tax History Compared to Growth
Tax History
| Year | Tax Paid | Tax Assessment Tax Assessment Total Assessment is a certain percentage of the fair market value that is determined by local assessors to be the total taxable value of land and additions on the property. | Land | Improvement |
|---|---|---|---|---|
| 2025 | $3,468 | $288,786 | $216,013 | $72,773 |
| 2024 | $3,468 | $283,124 | $211,777 | $71,347 |
| 2023 | $3,387 | $277,573 | $207,624 | $69,949 |
| 2022 | $3,349 | $272,131 | $203,553 | $68,578 |
| 2021 | $3,295 | $266,796 | $199,562 | $67,234 |
| 2020 | $3,264 | $264,061 | $197,516 | $66,545 |
| 2019 | $3,178 | $258,884 | $193,643 | $65,241 |
| 2018 | $3,125 | $253,808 | $189,846 | $63,962 |
| 2017 | $3,070 | $248,832 | $186,124 | $62,708 |
| 2016 | $2,999 | $243,953 | $182,474 | $61,479 |
| 2015 | $2,915 | $240,289 | $179,733 | $60,556 |
| 2014 | $2,830 | $235,583 | $176,213 | $59,370 |
Source: Public Records
Map
Nearby Homes
- 410 N Fonda St
- 1400 Eastpark Dr
- 224 S Fonda St
- 1936 Skywood St
- 2211 Frantz Ave
- 1508 Mccart Ave
- 1042 E La Habra Blvd Unit 233
- 1018 E La Habra Blvd Unit 238
- 1663 Gatewood Ct
- 994 E La Habra Blvd Unit 246
- 1506 Bergman Ct
- 308 S Valencia St
- 1414 W Central Ave Unit 88
- 2121 Lake Side Dr Unit 158
- 1341 Harbor Lake Ave Unit 24
- 1241 Arbolita Dr
- 2201 Lake View Dr Unit 20
- 620 Lake Ridge Way Unit 45
- 551 Lake Grove Way Unit 165
- 755 Village Lake Mall Unit 337
- 1710 Verdugo Ave
- 1701 Mateo Ave
- 1711 Mateo Ave
- 1720 Verdugo Ave
- 421 Vallejo St
- 1721 Mateo Ave
- 411 Vallejo St
- 431 Vallejo St
- 1701 Verdugo Ave
- 1650 E Verdugo Ave
- 1711 Verdugo Ave
- 1730 Verdugo Ave
- 401 Vallejo St
- 441 Vallejo St
- 1721 Verdugo Ave
- 1731 Mateo Ave
- 341 Vallejo St
- 1740 Verdugo Ave
- 1731 Verdugo Ave
- 400 N Fonda St