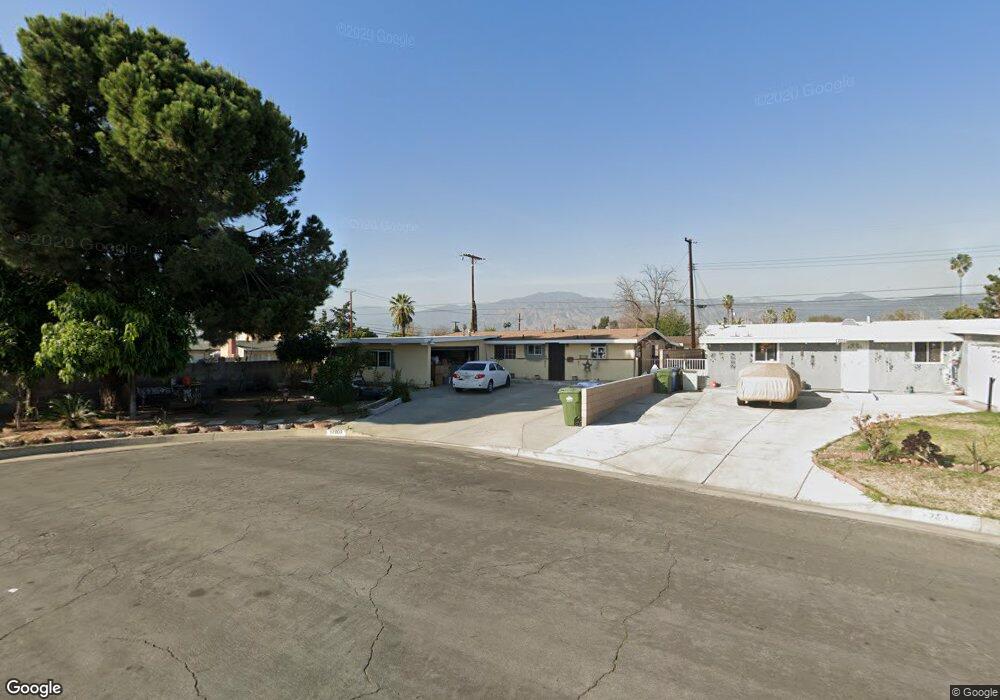
17003 E Nubia St Covina, CA 91722
South Azusa NeighborhoodEstimated Value: $703,014 - $743,000
4
Beds
2
Baths
1,144
Sq Ft
$632/Sq Ft
Est. Value
About This Home
This home is located at 17003 E Nubia St, Covina, CA 91722 and is currently estimated at $722,754, approximately $631 per square foot. 17003 E Nubia St is a home located in Los Angeles County with nearby schools including Alice M. Ellington Elementary School, Gladstone High School, and Center Middle School.
Ownership History
Date
Name
Owned For
Owner Type
Purchase Details
Closed on
Feb 11, 2020
Sold by
Flores Jose Francisco
Bought by
Flores Olivia G
Current Estimated Value
Home Financials for this Owner
Home Financials are based on the most recent Mortgage that was taken out on this home.
Original Mortgage
$251,000
Outstanding Balance
$222,243
Interest Rate
3.6%
Mortgage Type
New Conventional
Estimated Equity
$500,511
Purchase Details
Closed on
Oct 16, 2019
Sold by
Valenzuela Lino
Bought by
Valenzuela Olivia
Purchase Details
Closed on
Oct 10, 2019
Sold by
Valenzuela Olivia
Bought by
Valenzuela Olivia and Flores Olivia Guadalupe
Purchase Details
Closed on
Dec 11, 2002
Sold by
Valenzuela Lino and Valenzuela Olivia
Bought by
Valenzuela Lino and Valenzuela Olivia
Home Financials for this Owner
Home Financials are based on the most recent Mortgage that was taken out on this home.
Original Mortgage
$180,000
Interest Rate
5.86%
Create a Home Valuation Report for This Property
The Home Valuation Report is an in-depth analysis detailing your home's value as well as a comparison with similar homes in the area
Home Values in the Area
Average Home Value in this Area
Purchase History
| Date | Buyer | Sale Price | Title Company |
|---|---|---|---|
| Flores Olivia G | -- | North American Title Company | |
| Valenzuela Olivia | -- | None Available | |
| Valenzuela Olivia | -- | None Available | |
| Valenzuela Lino | -- | American Title Co |
Source: Public Records
Mortgage History
| Date | Status | Borrower | Loan Amount |
|---|---|---|---|
| Open | Flores Olivia G | $251,000 | |
| Previous Owner | Valenzuela Lino | $180,000 |
Source: Public Records
Tax History Compared to Growth
Tax History
| Year | Tax Paid | Tax Assessment Tax Assessment Total Assessment is a certain percentage of the fair market value that is determined by local assessors to be the total taxable value of land and additions on the property. | Land | Improvement |
|---|---|---|---|---|
| 2025 | $4,054 | $304,432 | $193,827 | $110,605 |
| 2024 | $4,054 | $298,464 | $190,027 | $108,437 |
| 2023 | $3,940 | $292,612 | $186,301 | $106,311 |
| 2022 | $3,892 | $286,876 | $182,649 | $104,227 |
| 2021 | $3,797 | $281,252 | $179,068 | $102,184 |
| 2020 | $3,728 | $278,369 | $177,232 | $101,137 |
| 2019 | $5,523 | $272,911 | $173,757 | $99,154 |
| 2018 | $5,302 | $267,560 | $170,350 | $97,210 |
| 2016 | $3,329 | $257,172 | $163,736 | $93,436 |
| 2015 | $3,289 | $253,310 | $161,277 | $92,033 |
| 2014 | $3,084 | $248,349 | $158,118 | $90,231 |
Source: Public Records
Map
Nearby Homes
- 16834 E Devanah St
- 17009 E Tudor St
- 17059 E Groverdale St
- 16737 E Greenhaven St
- 17141 E Tudor St
- 16715 E Masline St
- 5216 N Roxburgh Ave
- 16652 E Masline St
- 5246 N Clydebank Ave
- 1106 W Bellbrook St
- 1081 W Arrow Hwy Unit 96
- 16754 E Benwood St
- 5347 N Banewell Ave
- 16501 E Masline St
- 4850 N Vincent Ave
- 17139 E Newburgh St
- 815 W Grondahl St Unit E
- 4810 N Vincent Ave
- 814 W Grondahl St Unit A
- 17050 E Cypress St
- 17011 E Nubia St
- 17002 E Devanah St
- 17010 E Devanah St
- 17017 E Nubia St
- 17016 E Devanah St
- 17010 E Nubia St
- 16841 E Nubia St
- 17023 E Nubia St
- 16852 E Devanah St
- 17016 E Nubia St
- 17022 E Devanah St
- 16835 E Nubia St
- 17022 E Nubia St
- 16846 E Devanah St
- 17029 E Nubia St
- 17003 E Groverdale St
- 17003 E Devanah St
- 17011 E Groverdale St
- 17011 E Devanah St
- 17028 E Devanah St