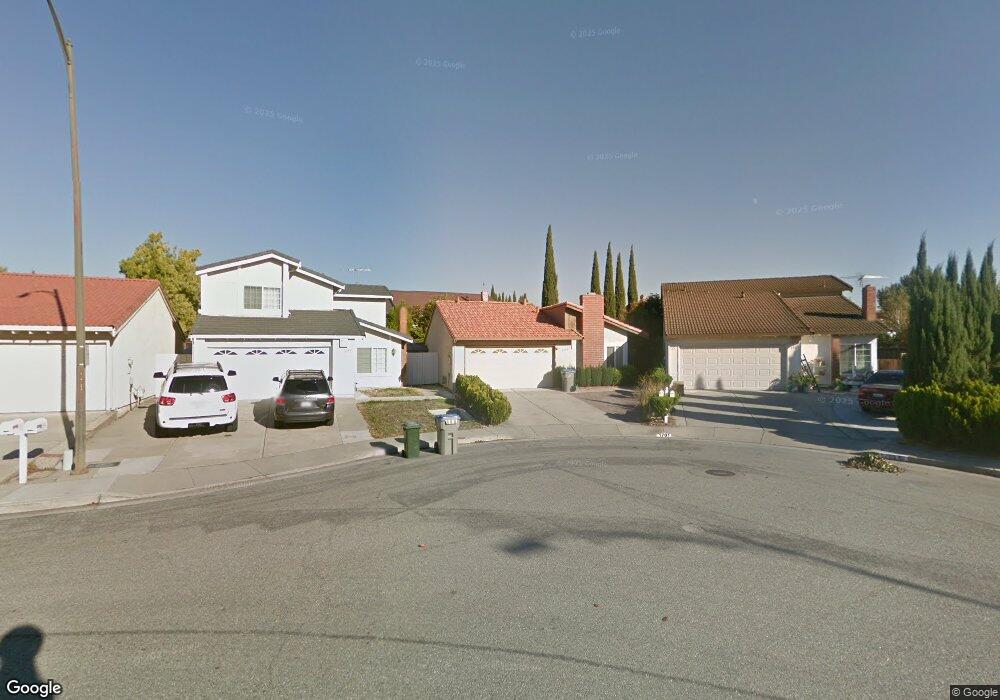
1701 Chesterton Cir San Jose, CA 95133
Commodore NeighborhoodEstimated Value: $1,201,602 - $1,448,000
3
Beds
2
Baths
1,150
Sq Ft
$1,136/Sq Ft
Est. Value
About This Home
This home is located at 1701 Chesterton Cir, San Jose, CA 95133 and is currently estimated at $1,305,901, approximately $1,135 per square foot. 1701 Chesterton Cir is a home located in Santa Clara County with nearby schools including Vinci Park Elementary School, Piedmont Middle School, and Independence High School.
Ownership History
Date
Name
Owned For
Owner Type
Purchase Details
Closed on
Jul 22, 2011
Sold by
Nguyen Tien T
Bought by
Nguyen Chanh H and Ha Lai T
Current Estimated Value
Home Financials for this Owner
Home Financials are based on the most recent Mortgage that was taken out on this home.
Original Mortgage
$175,000
Outstanding Balance
$120,110
Interest Rate
4.46%
Mortgage Type
New Conventional
Estimated Equity
$1,185,791
Purchase Details
Closed on
Nov 27, 2002
Sold by
Nguyen Khiem Binh
Bought by
Nguyen Tien T
Home Financials for this Owner
Home Financials are based on the most recent Mortgage that was taken out on this home.
Original Mortgage
$336,000
Interest Rate
6.28%
Purchase Details
Closed on
Nov 19, 2002
Sold by
Hsi Colin Kuo Liang and Hsi Cindy Igin
Bought by
Nguyen Tien T
Home Financials for this Owner
Home Financials are based on the most recent Mortgage that was taken out on this home.
Original Mortgage
$336,000
Interest Rate
6.28%
Create a Home Valuation Report for This Property
The Home Valuation Report is an in-depth analysis detailing your home's value as well as a comparison with similar homes in the area
Home Values in the Area
Average Home Value in this Area
Purchase History
| Date | Buyer | Sale Price | Title Company |
|---|---|---|---|
| Nguyen Chanh H | $422,000 | Chicago Title Company | |
| Nguyen Tien T | -- | Stewart Title Of California | |
| Nguyen Tien T | $420,000 | Stewart Title Of California |
Source: Public Records
Mortgage History
| Date | Status | Borrower | Loan Amount |
|---|---|---|---|
| Open | Nguyen Chanh H | $175,000 | |
| Previous Owner | Nguyen Tien T | $336,000 | |
| Closed | Nguyen Tien T | $63,000 |
Source: Public Records
Tax History Compared to Growth
Tax History
| Year | Tax Paid | Tax Assessment Tax Assessment Total Assessment is a certain percentage of the fair market value that is determined by local assessors to be the total taxable value of land and additions on the property. | Land | Improvement |
|---|---|---|---|---|
| 2025 | $8,024 | $530,043 | $318,027 | $212,016 |
| 2024 | $8,024 | $519,651 | $311,792 | $207,859 |
| 2023 | $8,024 | $509,463 | $305,679 | $203,784 |
| 2022 | $7,827 | $499,475 | $299,686 | $199,789 |
| 2021 | $7,560 | $489,682 | $293,810 | $195,872 |
| 2020 | $7,315 | $484,662 | $290,798 | $193,864 |
| 2019 | $7,034 | $475,160 | $285,097 | $190,063 |
| 2018 | $6,927 | $465,844 | $279,507 | $186,337 |
| 2017 | $6,957 | $456,711 | $274,027 | $182,684 |
| 2016 | $6,666 | $447,756 | $268,654 | $179,102 |
| 2015 | $6,584 | $441,031 | $264,619 | $176,412 |
| 2014 | $5,959 | $432,393 | $259,436 | $172,957 |
Source: Public Records
Map
Nearby Homes
- 1713 Winston St
- 1660 Solari Place
- 1146 Rosebriar Way
- 1027 Giacomo Ln Unit 7
- 1945 Galileo Ln
- 1049 Branbury Way
- 1036 Onofrio Ln Unit 6
- 1957 Cape Horn Dr
- 1538 Neleigh Place
- 12280 Mabury Rd
- 2044 Voss Park Ln
- 1210 Briarcreek Ct
- 1233 Briarleaf Cir
- 1368 Neleigh Place
- 1824 Seville Way
- 1087 Yarrow Terrace
- 1055 Thyme Walkway
- 832 N Jackson Ave
- 2324 Mossdale Way
- 2328 Mossdale Way
- 1703 Chesterton Cir
- 1699 Chesterton Cir
- 933 Cape Buffalo Dr
- 929 Cape Buffalo Dr
- 1705 Chesterton Cir
- 1697 Chesterton Cir
- 937 Cape Buffalo Dr
- 1707 Chesterton Cir
- 924 Cape Canaveral Place
- 1695 Chesterton Cir
- 925 Cape Buffalo Dr
- 923 Cape Canaveral Place
- 941 Cape Buffalo Dr
- 1708 Chesterton Cir
- 1709 Chesterton Cir
- 1693 Chesterton Cir
- 921 Cape Buffalo Dr
- 945 Cape Buffalo Dr
- 1710 Chesterton Cir
- 1711 Chesterton Cir