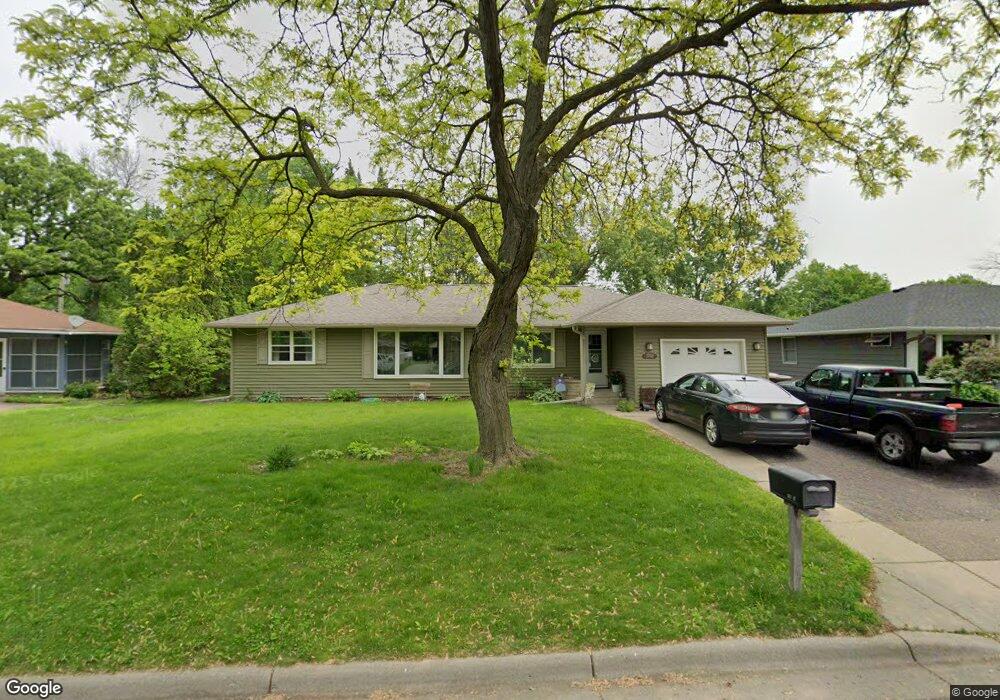
1701 Maple St Hastings, MN 55033
Hastings-Marshan Township NeighborhoodEstimated Value: $349,798 - $428,000
4
Beds
2
Baths
1,442
Sq Ft
$263/Sq Ft
Est. Value
About This Home
This home is located at 1701 Maple St, Hastings, MN 55033 and is currently estimated at $379,700, approximately $263 per square foot. 1701 Maple St is a home located in Dakota County with nearby schools including Pinecrest Elementary School, Hastings Middle School, and Hastings High School.
Ownership History
Date
Name
Owned For
Owner Type
Purchase Details
Closed on
Sep 20, 2018
Sold by
Lorentz Lucas K and Lorentz Lauren
Bought by
Clark Matthew J and Clark Anita M
Current Estimated Value
Home Financials for this Owner
Home Financials are based on the most recent Mortgage that was taken out on this home.
Original Mortgage
$245,471
Outstanding Balance
$214,767
Interest Rate
4.75%
Mortgage Type
FHA
Estimated Equity
$164,933
Purchase Details
Closed on
Jun 26, 2015
Sold by
Humble Thomas W and Humble Lyndee K
Bought by
Lorentz Lucas K
Home Financials for this Owner
Home Financials are based on the most recent Mortgage that was taken out on this home.
Original Mortgage
$193,400
Interest Rate
3.5%
Mortgage Type
FHA
Purchase Details
Closed on
Jun 28, 2007
Sold by
Not Provided
Bought by
Humble Thomas and Jereczek Lyndee
Create a Home Valuation Report for This Property
The Home Valuation Report is an in-depth analysis detailing your home's value as well as a comparison with similar homes in the area
Home Values in the Area
Average Home Value in this Area
Purchase History
| Date | Buyer | Sale Price | Title Company |
|---|---|---|---|
| Clark Matthew J | $250,000 | Land Title Inc | |
| Lorentz Lucas K | $197,000 | Dca Title | |
| Humble Thomas | $212,000 | -- |
Source: Public Records
Mortgage History
| Date | Status | Borrower | Loan Amount |
|---|---|---|---|
| Open | Clark Matthew J | $245,471 | |
| Previous Owner | Lorentz Lucas K | $193,400 |
Source: Public Records
Tax History
| Year | Tax Paid | Tax Assessment Tax Assessment Total Assessment is a certain percentage of the fair market value that is determined by local assessors to be the total taxable value of land and additions on the property. | Land | Improvement |
|---|---|---|---|---|
| 2024 | $4,046 | $346,400 | $66,400 | $280,000 |
| 2023 | $4,046 | $354,700 | $66,400 | $288,300 |
| 2022 | $3,202 | $333,500 | $66,300 | $267,200 |
| 2021 | $3,126 | $270,600 | $57,700 | $212,900 |
| 2020 | $3,134 | $263,200 | $53,900 | $209,300 |
| 2019 | $2,986 | $255,700 | $52,400 | $203,300 |
| 2018 | $2,771 | $233,800 | $49,900 | $183,900 |
| 2017 | $2,571 | $212,500 | $47,500 | $165,000 |
| 2016 | $2,569 | $198,700 | $44,400 | $154,300 |
| 2015 | $2,272 | $174,329 | $38,710 | $135,619 |
| 2014 | -- | $154,382 | $36,444 | $117,938 |
| 2013 | -- | $132,037 | $31,968 | $100,069 |
Source: Public Records
Map
Nearby Homes
Your Personal Tour Guide
Ask me questions while you tour the home.