
Seller's Agent in 2025
Dana Price
KELLER WILLIAMS-TREC
(217) 254-4614
175 in this area
292 Total Sales
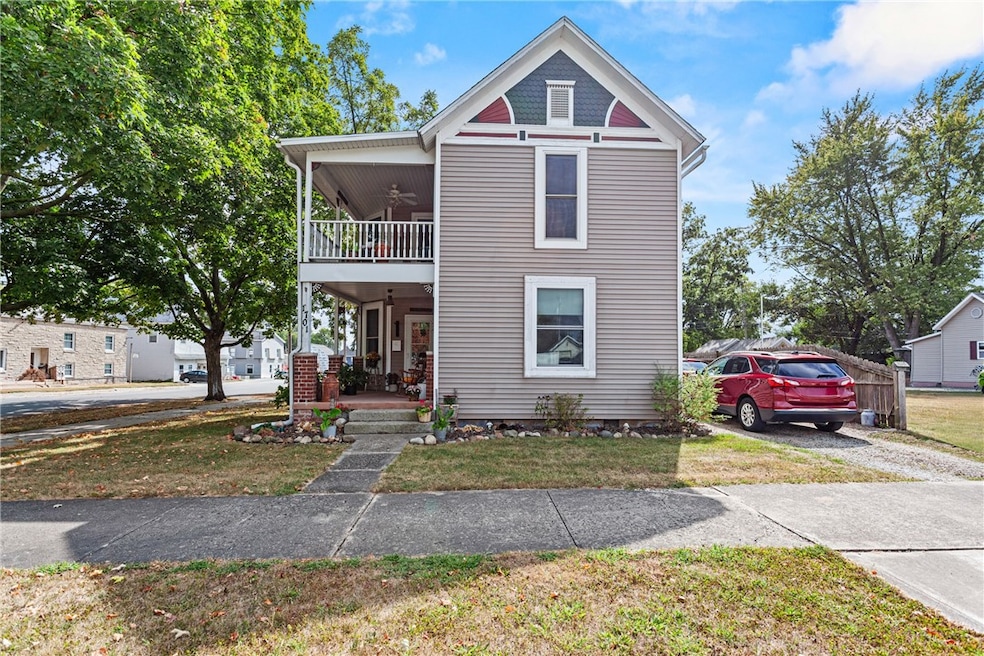
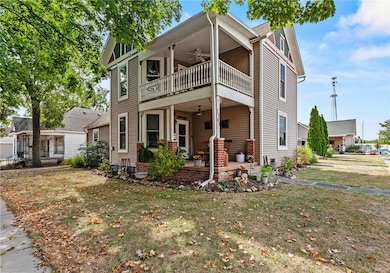
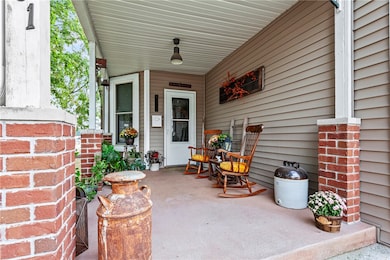
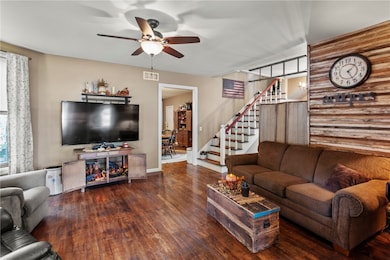
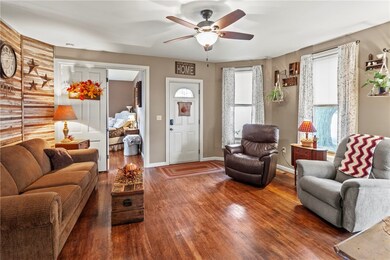
Welcome to this inviting two-story Victorian that beautifully blends timeless charm with modern living. The home greets you with a welcoming front porch, perfect for relaxing afternoons. Inside, you’ll find a nicely sized living room featuring a charming accent wall, adding character to the space.
The main floor hosts the master bedroom complete with its own master bath, offering convenience and privacy. Adjacent to the staircase, there’s a cozy sitting area that’s perfect for a reading nook or a quiet corner.
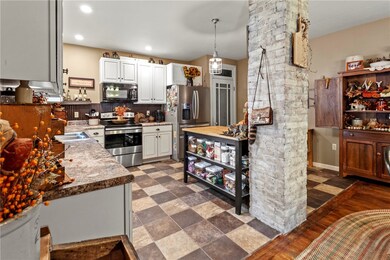
The large eat-in kitchen is a highlight, boasting antique white custom cabinets, stainless steel appliances, a striking black island for extra storage, and a charming brick accent that adds rustic flair. The main floor also includes a laundry area paired with a convenient half bath.
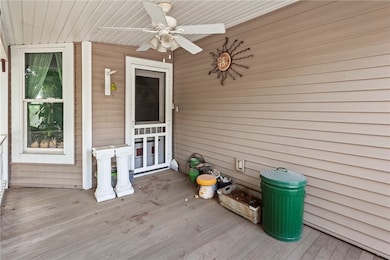
Heading upstairs, you’ll find another cozy sitting area at the top of the stairs, along with two additional bedrooms and a full bath featuring a walk-in shower. One of the upstairs bedrooms even opens directly onto the second-level porch, offering a lovely outdoor escape.
The home also includes an unfinished partial basement and a great outdoor entertaining area with a nicely sized deck. Altogether, this Victorian gem is a unique blend of classic elegance and modern convenience, ready to welcome you home.
The property has been completely remodeled down to the studs in 2015 with complete new wiring/plumbing/windows/drywall. Roof-2022, HVAC-2015, hot water heater-2015, refrigerator-2024,
Last Agent to Sell the Property
KELLER WILLIAMS-TREC License #475174755 Listed on: 09/23/2025
| Date | Type | Sale Price | Title Company |
|---|---|---|---|
| Warranty Deed | $160,000 | None Listed On Document | |
| Quit Claim Deed | -- | -- | |
| Interfamily Deed Transfer | -- | None Available |
| Date | Status | Loan Amount | Loan Type |
|---|---|---|---|
| Open | $144,000 | Credit Line Revolving |
| Date | Event | Price | List to Sale | Price per Sq Ft |
|---|---|---|---|---|
| 12/01/2025 12/01/25 | Sold | $160,000 | -13.3% | $88 / Sq Ft |
| 10/16/2025 10/16/25 | Pending | -- | -- | -- |
| 09/23/2025 09/23/25 | For Sale | $184,500 | -- | $102 / Sq Ft |
| Year | Tax Paid | Tax Assessment Tax Assessment Total Assessment is a certain percentage of the fair market value that is determined by local assessors to be the total taxable value of land and additions on the property. | Land | Improvement |
|---|---|---|---|---|
| 2024 | $3,413 | $40,165 | $1,487 | $38,678 |
| 2023 | $1,175 | $13,659 | $1,646 | $12,013 |
| 2022 | $1,175 | $13,434 | $1,619 | $11,815 |
| 2021 | $1,178 | $12,339 | $2,853 | $9,486 |
| 2020 | $1,166 | $12,784 | $2,956 | $9,828 |
| 2019 | $1,147 | $12,339 | $2,853 | $9,486 |
| 2018 | $1,093 | $11,958 | $2,853 | $9,105 |
| 2017 | $1,089 | $11,958 | $2,853 | $9,105 |
| 2016 | $1,067 | $11,958 | $2,853 | $9,105 |
| 2015 | $526 | $11,958 | $2,853 | $9,105 |
| 2014 | $526 | $11,958 | $2,853 | $9,105 |
| 2013 | $526 | $11,958 | $2,853 | $9,105 |
Seller's Agent in 2025
Dana Price
KELLER WILLIAMS-TREC
(217) 254-4614
175 in this area
292 Total Sales
K
Buyer's Agent in 2025
Kim Dow
Sanders & Company
(217) 273-5248
20 in this area
27 Total Sales
Source: Central Illinois Board of REALTORS®
MLS Number: 6255309
APN: 07-1-05174-000
Ask me questions while you tour the home.