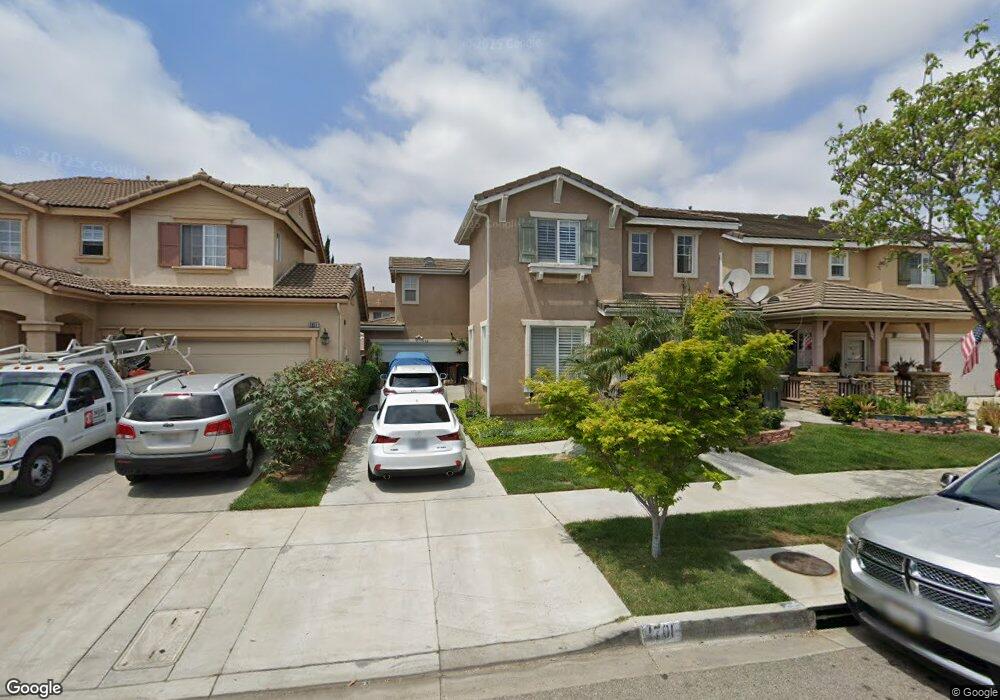
1701 Sonata Dr Unit 12 Oxnard, CA 93030
West Village NeighborhoodEstimated Value: $756,084 - $814,000
3
Beds
3
Baths
1,873
Sq Ft
$419/Sq Ft
Est. Value
About This Home
This home is located at 1701 Sonata Dr Unit 12, Oxnard, CA 93030 and is currently estimated at $785,021, approximately $419 per square foot. 1701 Sonata Dr Unit 12 is a home located in Ventura County with nearby schools including Brekke Elementary School, R.J. Frank Academy of Marine Science & Engineering, and Pacifica High School.
Ownership History
Date
Name
Owned For
Owner Type
Purchase Details
Closed on
Jul 9, 2021
Sold by
Luu Van
Bought by
Luu Van
Current Estimated Value
Home Financials for this Owner
Home Financials are based on the most recent Mortgage that was taken out on this home.
Original Mortgage
$405,000
Interest Rate
2.8%
Mortgage Type
New Conventional
Purchase Details
Closed on
Mar 17, 2005
Sold by
Crawford James D
Bought by
Luu Van
Home Financials for this Owner
Home Financials are based on the most recent Mortgage that was taken out on this home.
Original Mortgage
$311,000
Interest Rate
5.77%
Mortgage Type
New Conventional
Purchase Details
Closed on
May 20, 2002
Sold by
Ox Ii Oxnard Lp
Bought by
Crawford James D
Home Financials for this Owner
Home Financials are based on the most recent Mortgage that was taken out on this home.
Original Mortgage
$229,250
Interest Rate
6.6%
Create a Home Valuation Report for This Property
The Home Valuation Report is an in-depth analysis detailing your home's value as well as a comparison with similar homes in the area
Home Values in the Area
Average Home Value in this Area
Purchase History
| Date | Buyer | Sale Price | Title Company |
|---|---|---|---|
| Luu Van | $550,000 | First American Title Company | |
| Luu Van | $311,000 | Ticor Title Company Of Ca | |
| Crawford James D | $288,000 | Fidelity National Title Co |
Source: Public Records
Mortgage History
| Date | Status | Borrower | Loan Amount |
|---|---|---|---|
| Previous Owner | Luu Van | $405,000 | |
| Previous Owner | Luu Van | $311,000 | |
| Previous Owner | Crawford James D | $229,250 |
Source: Public Records
Tax History
| Year | Tax Paid | Tax Assessment Tax Assessment Total Assessment is a certain percentage of the fair market value that is determined by local assessors to be the total taxable value of land and additions on the property. | Land | Improvement |
|---|---|---|---|---|
| 2025 | $9,322 | $726,927 | $472,238 | $254,689 |
| 2024 | $9,322 | $712,674 | $462,978 | $249,696 |
| 2023 | $8,415 | $698,700 | $453,900 | $244,800 |
| 2022 | $8,260 | $685,000 | $445,000 | $240,000 |
| 2021 | $4,660 | $384,919 | $153,963 | $230,956 |
| 2020 | $4,743 | $380,974 | $152,385 | $228,589 |
| 2019 | $4,610 | $373,505 | $149,398 | $224,107 |
| 2018 | $4,504 | $366,182 | $146,469 | $219,713 |
| 2017 | $4,274 | $359,003 | $143,598 | $215,405 |
| 2016 | $4,443 | $351,965 | $140,783 | $211,182 |
| 2015 | $4,951 | $346,680 | $138,669 | $208,011 |
| 2014 | $4,904 | $339,891 | $135,953 | $203,938 |
Source: Public Records
Map
Nearby Homes
- 1902 Ribera Dr Unit 86
- 1930 Ribera Dr
- 565 Rosalinda Dr
- 2030 Ocaso Place
- 208 Bolero Ln
- 207 Hermano Trail
- 2010 Camino Del Sol
- 139 Stanford Ave
- 902 Paseo Brisas Lindas
- 2701 Alvarado St
- 2012 Blackberry Cir
- 2016 Blackberry Cir
- 211 Featherstone St
- 2160 Blackberry Cir
- 2041 Blackberry Cir
- 2031 Blackberry Cir
- 400 N Hayes Ave
- 0 Alvarado St
- 255 Douglas Ave
- 246 Doris Ave
- 1651 Sonata Dr
- 1711 Sonata Dr
- 1641 Sonata Dr
- 1721 Sonata Dr
- 1632 Almanor St
- 1642 Almanor St
- 1631 Sonata Dr Unit 15
- 1622 Almanor St
- 1731 Sonata Dr
- 1702 Almanor St
- 1621 Sonata Dr
- 1712 Sonata Dr
- 1642 Sonata Dr
- 1612 Almanor St
- 1741 Sonata Dr
- 1722 Sonata Dr Unit 38
- 1712 Almanor St
- 1632 Sonata Dr
- 1732 Sonata Dr
- 1751 Sonata Dr Unit 7
Your Personal Tour Guide
Ask me questions while you tour the home.