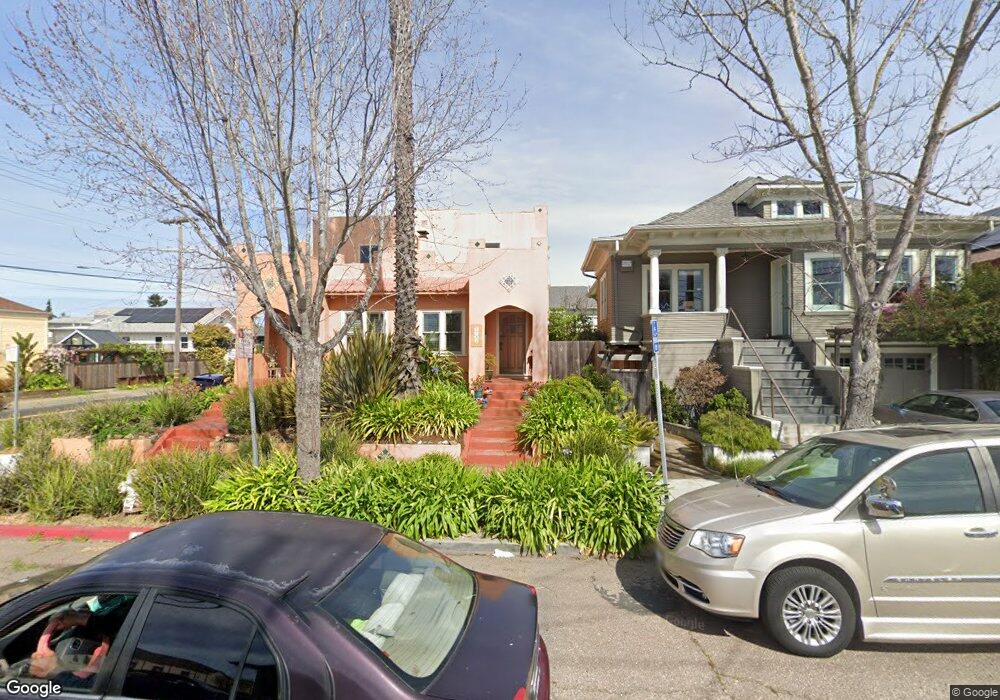
1701 Stuart St Berkeley, CA 94703
South Berkeley NeighborhoodEstimated Value: $475,000 - $1,668,420
4
Beds
3
Baths
1,830
Sq Ft
$621/Sq Ft
Est. Value
About This Home
This home is located at 1701 Stuart St, Berkeley, CA 94703 and is currently estimated at $1,135,855, approximately $620 per square foot. 1701 Stuart St is a home located in Alameda County with nearby schools including Malcolm X Elementary School, Emerson Elementary School, and John Muir Elementary School.
Ownership History
Date
Name
Owned For
Owner Type
Purchase Details
Closed on
Dec 11, 1998
Sold by
Korwin Lisa and Goldberg Susan
Bought by
Ayers Rebekah Rose
Current Estimated Value
Home Financials for this Owner
Home Financials are based on the most recent Mortgage that was taken out on this home.
Original Mortgage
$188,500
Outstanding Balance
$45,007
Interest Rate
7.37%
Estimated Equity
$1,090,848
Create a Home Valuation Report for This Property
The Home Valuation Report is an in-depth analysis detailing your home's value as well as a comparison with similar homes in the area
Home Values in the Area
Average Home Value in this Area
Purchase History
| Date | Buyer | Sale Price | Title Company |
|---|---|---|---|
| Ayers Rebekah Rose | $236,000 | Old Republic Title Company |
Source: Public Records
Mortgage History
| Date | Status | Borrower | Loan Amount |
|---|---|---|---|
| Open | Ayers Rebekah Rose | $188,500 |
Source: Public Records
Tax History
| Year | Tax Paid | Tax Assessment Tax Assessment Total Assessment is a certain percentage of the fair market value that is determined by local assessors to be the total taxable value of land and additions on the property. | Land | Improvement |
|---|---|---|---|---|
| 2025 | $8,676 | $412,433 | $110,987 | $301,446 |
| 2024 | $8,676 | $404,348 | $108,811 | $295,537 |
| 2023 | $8,453 | $396,421 | $106,678 | $289,743 |
| 2022 | $8,234 | $388,649 | $104,587 | $284,062 |
| 2021 | $8,209 | $381,030 | $102,536 | $278,494 |
| 2020 | $7,664 | $377,123 | $101,485 | $275,638 |
| 2019 | $7,242 | $369,730 | $99,495 | $270,235 |
| 2018 | $7,080 | $362,482 | $97,545 | $264,937 |
| 2017 | $6,797 | $355,376 | $95,633 | $259,743 |
| 2016 | $6,494 | $348,409 | $93,758 | $254,651 |
| 2015 | $6,388 | $343,177 | $92,350 | $250,827 |
| 2014 | $6,174 | $336,455 | $90,541 | $245,914 |
Source: Public Records
Map
Nearby Homes
- 2829 California St
- 2701 Grant St
- 2926 Ellis St
- 1726 Parker St Unit 2
- 1726 Parker St Unit 1
- 1612 Parker St
- 1515 Derby St
- 1819 Carleton St
- 2750 Sacramento St
- 2782 Sacramento St
- 2774 Sacramento St
- 2790 Sacramento St
- 2758 Sacramento St
- 1450 Ward St
- 1634 Blake St
- 2533 Grant St
- 1538 Ashby Ave
- 1524 Blake St
- 1901 Parker St Unit 3
- 1516 Blake St
Your Personal Tour Guide
Ask me questions while you tour the home.