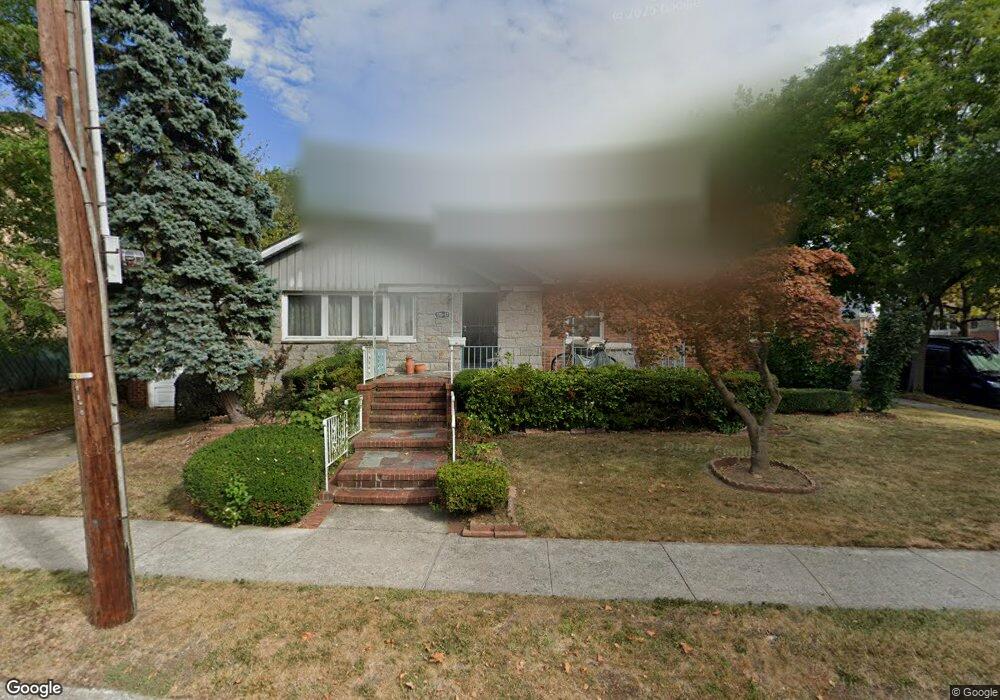
17017 75th Ave Fresh Meadows, NY 11366
Hillcrest NeighborhoodEstimated Value: $1,203,000 - $1,333,000
--
Bed
--
Bath
1,350
Sq Ft
$947/Sq Ft
Est. Value
About This Home
This home is located at 17017 75th Ave, Fresh Meadows, NY 11366 and is currently estimated at $1,278,667, approximately $947 per square foot. 17017 75th Ave is a home located in Queens County with nearby schools including P.S. 173 - Fresh Meadow, George J. Ryan Middle School 216, and Holy Family School.
Ownership History
Date
Name
Owned For
Owner Type
Purchase Details
Closed on
Nov 8, 2004
Sold by
Hanna Monagah N and Hanna Rohy I
Bought by
Solomon Samson and Solomon Simkha
Current Estimated Value
Home Financials for this Owner
Home Financials are based on the most recent Mortgage that was taken out on this home.
Original Mortgage
$517,600
Outstanding Balance
$258,644
Interest Rate
5.8%
Mortgage Type
Purchase Money Mortgage
Estimated Equity
$1,020,023
Create a Home Valuation Report for This Property
The Home Valuation Report is an in-depth analysis detailing your home's value as well as a comparison with similar homes in the area
Home Values in the Area
Average Home Value in this Area
Purchase History
| Date | Buyer | Sale Price | Title Company |
|---|---|---|---|
| Solomon Samson | $647,000 | -- |
Source: Public Records
Mortgage History
| Date | Status | Borrower | Loan Amount |
|---|---|---|---|
| Open | Solomon Samson | $517,600 |
Source: Public Records
Tax History Compared to Growth
Tax History
| Year | Tax Paid | Tax Assessment Tax Assessment Total Assessment is a certain percentage of the fair market value that is determined by local assessors to be the total taxable value of land and additions on the property. | Land | Improvement |
|---|---|---|---|---|
| 2025 | $10,795 | $56,970 | $17,995 | $38,975 |
| 2024 | $10,795 | $53,746 | $19,299 | $34,447 |
| 2023 | $10,595 | $52,751 | $18,664 | $34,087 |
| 2022 | $10,107 | $61,980 | $23,160 | $38,820 |
| 2021 | $9,935 | $60,540 | $23,160 | $37,380 |
| 2020 | $10,049 | $58,620 | $23,160 | $35,460 |
| 2019 | $9,369 | $56,760 | $23,160 | $33,600 |
| 2018 | $8,961 | $43,959 | $19,846 | $24,113 |
| 2017 | $8,454 | $41,472 | $20,980 | $20,492 |
| 2016 | $8,291 | $41,472 | $20,980 | $20,492 |
| 2015 | -- | $39,563 | $22,480 | $17,083 |
| 2014 | -- | $37,324 | $18,793 | $18,531 |
Source: Public Records
Map
Nearby Homes