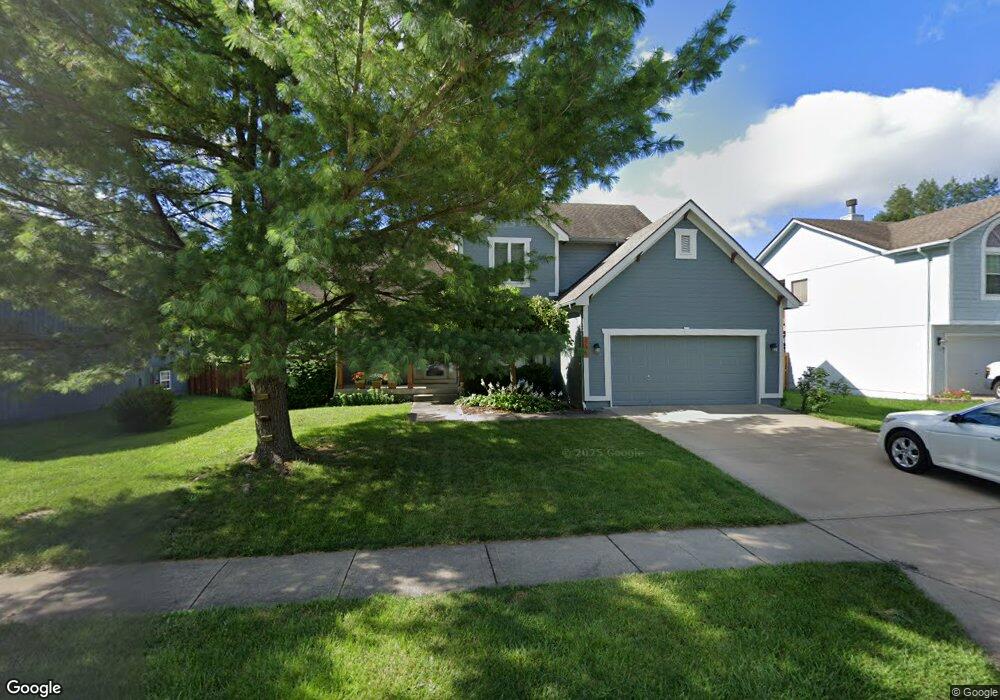
17017 E 44th St S Independence, MO 64055
39th East NeighborhoodEstimated Value: $295,000 - $364,000
3
Beds
3
Baths
2,040
Sq Ft
$166/Sq Ft
Est. Value
About This Home
This home is located at 17017 E 44th St S, Independence, MO 64055 and is currently estimated at $337,955, approximately $165 per square foot. 17017 E 44th St S is a home located in Jackson County with nearby schools including William Yates Elementary School, Delta Woods Middle School, and Blue Springs High School.
Ownership History
Date
Name
Owned For
Owner Type
Purchase Details
Closed on
May 29, 2014
Sold by
Berard Living Trust
Bought by
Shaw Gordon W and Shaw Melissa S
Current Estimated Value
Home Financials for this Owner
Home Financials are based on the most recent Mortgage that was taken out on this home.
Original Mortgage
$162,000
Outstanding Balance
$123,417
Interest Rate
4.32%
Mortgage Type
New Conventional
Estimated Equity
$214,538
Purchase Details
Closed on
Aug 20, 2009
Sold by
Otten Leon J and Gran Carole C
Bought by
Berard Dennis W and Berard Sherry L
Purchase Details
Closed on
Dec 10, 1996
Sold by
Aspen Development Lc
Bought by
Otten Leon J and Otten Bernadine M
Purchase Details
Closed on
Mar 28, 1996
Sold by
Kerrington Woods Lp
Bought by
Aspen Development Lc
Purchase Details
Closed on
Oct 2, 1995
Sold by
Miller Enterprises Inc
Bought by
Kerrington Woods Lp
Create a Home Valuation Report for This Property
The Home Valuation Report is an in-depth analysis detailing your home's value as well as a comparison with similar homes in the area
Home Values in the Area
Average Home Value in this Area
Purchase History
| Date | Buyer | Sale Price | Title Company |
|---|---|---|---|
| Shaw Gordon W | -- | None Available | |
| Berard Dennis W | -- | Kansas City Title | |
| Otten Leon J | -- | Nations Title Agency Inc | |
| Aspen Development Lc | -- | -- | |
| Kerrington Woods Lp | -- | Nations Title Agency Inc |
Source: Public Records
Mortgage History
| Date | Status | Borrower | Loan Amount |
|---|---|---|---|
| Open | Shaw Gordon W | $162,000 | |
| Closed | Aspen Development Lc | $0 |
Source: Public Records
Tax History
| Year | Tax Paid | Tax Assessment Tax Assessment Total Assessment is a certain percentage of the fair market value that is determined by local assessors to be the total taxable value of land and additions on the property. | Land | Improvement |
|---|---|---|---|---|
| 2025 | $3,509 | $58,547 | $9,031 | $49,516 |
| 2024 | $3,436 | $51,158 | $5,483 | $45,675 |
| 2023 | $3,436 | $51,158 | $6,614 | $44,544 |
| 2022 | $3,399 | $44,270 | $4,844 | $39,426 |
| 2021 | $3,398 | $44,270 | $4,844 | $39,426 |
| 2020 | $3,012 | $38,660 | $4,844 | $33,816 |
| 2019 | $2,911 | $38,660 | $4,844 | $33,816 |
| 2018 | $2,611 | $33,646 | $4,216 | $29,430 |
| 2017 | $2,611 | $33,646 | $4,216 | $29,430 |
| 2016 | $2,506 | $32,433 | $4,009 | $28,424 |
Source: Public Records
Map
Nearby Homes
- 17005 E 43rd Terrace Ct S
- 17205 E 44th Street Ct S
- 4315 S Davidson Dr
- 16904 E 43rd St S
- 17215 E 44th Street Ct S
- 17221 E 44th Terrace Ct S
- 17105 E 45th St S
- 4310 S Atherton Ct
- 4225 S Milton Dr
- 4326 S Bryant Dr
- 17318 E Us Highway 40
- 4317 S Megan Ct Unit 19
- 4005 S Coachman Dr
- 4013 S Maybrook Ave
- 17424 E 41st Terrace S
- 3925 S Bedford Ave
- 16405 E 40th St S
- 3824 S Milton Dr
- 5300 Lees Summit Rd
- 4921 S Peck Ave
- 17013 E 44th St S
- 17021 E 44th St S
- 17009 E 44th St S
- 17025 E 44th Street S N A
- 17025 E 44th St S
- 17016 E 44th St S
- 17020 E 44th St S
- 17012 E 44th St S
- 17005 E 44th St S
- 17029 E 44th St S
- 17008 E 44th St S
- 17024 E 44th St S
- 4316 S Shrank Ct
- 17004 E 44th St S
- 17028 E 44th St S
- 17001 E 44th St S
- 17009 E 43rd Terrace Ct S
- 17000 E 44th St S
- 4312 S Shrank Ct
- 4317 S Shrank Ct
Your Personal Tour Guide
Ask me questions while you tour the home.