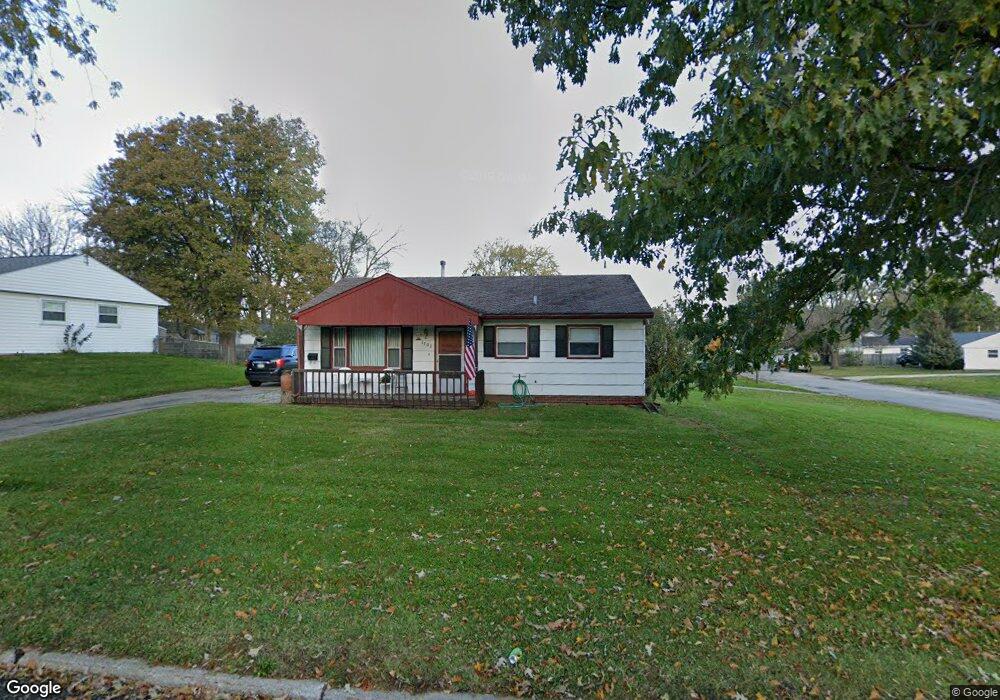
1702 11th Ave SW Cedar Rapids, IA 52404
Cleveland Area NeighborhoodEstimated Value: $125,000 - $147,000
3
Beds
1
Bath
864
Sq Ft
$154/Sq Ft
Est. Value
About This Home
This home is located at 1702 11th Ave SW, Cedar Rapids, IA 52404 and is currently estimated at $132,640, approximately $153 per square foot. 1702 11th Ave SW is a home located in Linn County with nearby schools including Cleveland Elementary School, Roosevelt Creative Corridor Business Academy, and Thomas Jefferson High School.
Ownership History
Date
Name
Owned For
Owner Type
Purchase Details
Closed on
Mar 28, 2006
Sold by
Hansen Christopher G and Hansen Graig A
Bought by
Larson Troy L and Larson Heather F
Current Estimated Value
Home Financials for this Owner
Home Financials are based on the most recent Mortgage that was taken out on this home.
Original Mortgage
$4,000
Interest Rate
6.34%
Mortgage Type
Stand Alone Second
Purchase Details
Closed on
Mar 27, 2006
Sold by
Daubenmier Richard A and Daubenmier Joann
Bought by
Larson Troy L and Larson Heather F
Home Financials for this Owner
Home Financials are based on the most recent Mortgage that was taken out on this home.
Original Mortgage
$4,000
Interest Rate
6.34%
Mortgage Type
Stand Alone Second
Purchase Details
Closed on
Jan 12, 1999
Sold by
Haynes Alice L
Bought by
Hansen Judith R and Daubenmier Richard A
Create a Home Valuation Report for This Property
The Home Valuation Report is an in-depth analysis detailing your home's value as well as a comparison with similar homes in the area
Home Values in the Area
Average Home Value in this Area
Purchase History
| Date | Buyer | Sale Price | Title Company |
|---|---|---|---|
| Larson Troy L | $79,500 | None Available | |
| Larson Troy L | -- | None Available | |
| Hansen Judith R | -- | -- |
Source: Public Records
Mortgage History
| Date | Status | Borrower | Loan Amount |
|---|---|---|---|
| Closed | Larson Troy L | $4,000 | |
| Open | Larson Troy L | $68,000 |
Source: Public Records
Tax History
| Year | Tax Paid | Tax Assessment Tax Assessment Total Assessment is a certain percentage of the fair market value that is determined by local assessors to be the total taxable value of land and additions on the property. | Land | Improvement |
|---|---|---|---|---|
| 2025 | $1,572 | $108,100 | $32,200 | $75,900 |
| 2024 | $1,654 | $100,900 | $29,300 | $71,600 |
| 2023 | $1,654 | $99,300 | $29,300 | $70,000 |
| 2022 | $1,548 | $87,300 | $24,900 | $62,400 |
| 2021 | $1,588 | $83,700 | $24,900 | $58,800 |
| 2020 | $1,588 | $80,600 | $23,400 | $57,200 |
| 2019 | $1,426 | $78,800 | $23,400 | $55,400 |
Source: Public Records
Map
Nearby Homes
- 1605 11th Ave SW
- 1209 16th St SW
- 1807 9th Ave SW
- 147 18th St SW
- 1818 Chandler St SW
- 1909 Williams Blvd SW
- 1602 1st Ave NW
- 1421 1st Ave SW
- 1818 Holly Meadow Ave SW
- 1812 Holly Meadow Ave SW
- 139 21st St SW
- 1243 16th Ave SW
- 250 Highland Dr NW
- 2103 Shady Grove Rd SW
- 1221 A Ave NW
- 1118 2nd Ave SW
- 2207 Shady Grove Rd SW
- 1155 A Ave NW
- 1338 Hinkley Ave NW
- 1227 19th Ave SW
- 1706 11th Ave SW
- 1014 17th St SW
- 1710 11th Ave SW
- 1618 11th Ave SW
- 1701 11th Ave SW
- 1703 11th Ave SW
- 1011 17th St SW
- 1010 17th St SW
- 1611 11th Ave SW
- 1705 11th Ave SW
- 1714 11th Ave SW
- 1707 11th Ave SW
- 1609 11th Ave SW
- 1007 17th St SW
- 1614 11th Ave SW
- 1023 18th St SW
- 1709 11th Ave SW
- 1006 17th St SW
- 1019 18th St SW
- 1607 11th Ave SW
Your Personal Tour Guide
Ask me questions while you tour the home.