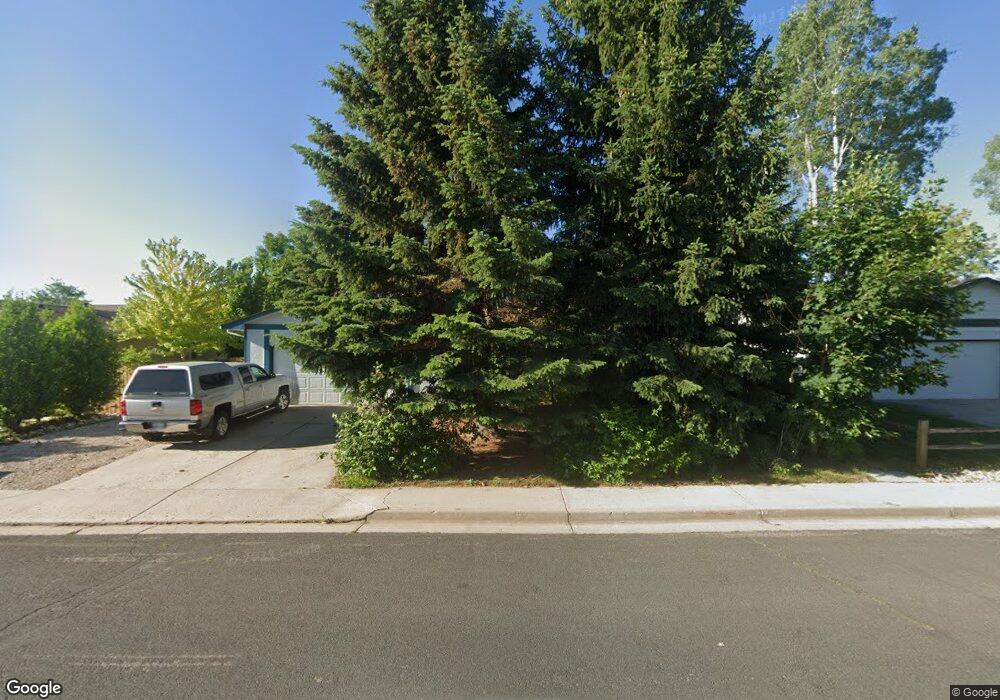
1702 3rd St SW Loveland, CO 80537
Estimated Value: $465,767 - $500,000
5
Beds
3
Baths
2,576
Sq Ft
$188/Sq Ft
Est. Value
About This Home
This home is located at 1702 3rd St SW, Loveland, CO 80537 and is currently estimated at $484,942, approximately $188 per square foot. 1702 3rd St SW is a home located in Larimer County with nearby schools including Sarah Milner Elementary School, Walt Clark Middle School, and Thompson Valley High School.
Ownership History
Date
Name
Owned For
Owner Type
Purchase Details
Closed on
Jul 21, 2014
Sold by
Detwiler Charles E and Nicaise Mary Ann
Bought by
Detwiler Charles E and Nicaise Detwiler Mary Ann
Current Estimated Value
Home Financials for this Owner
Home Financials are based on the most recent Mortgage that was taken out on this home.
Original Mortgage
$170,940
Outstanding Balance
$130,643
Interest Rate
4.25%
Mortgage Type
FHA
Estimated Equity
$354,299
Purchase Details
Closed on
Sep 3, 2003
Sold by
Detwiler Charles E
Bought by
Nicaise Mary Ann and Detwiler Charles E
Purchase Details
Closed on
Jun 18, 1999
Sold by
Detwiler Charles Bonnie J
Bought by
Detwiler Charles
Home Financials for this Owner
Home Financials are based on the most recent Mortgage that was taken out on this home.
Original Mortgage
$101,250
Interest Rate
7.11%
Purchase Details
Closed on
Dec 1, 1986
Bought by
Detwiler Charles
Create a Home Valuation Report for This Property
The Home Valuation Report is an in-depth analysis detailing your home's value as well as a comparison with similar homes in the area
Home Values in the Area
Average Home Value in this Area
Purchase History
| Date | Buyer | Sale Price | Title Company |
|---|---|---|---|
| Detwiler Charles E | -- | North American Title | |
| Nicaise Mary Ann | -- | -- | |
| Detwiler Charles | -- | -- | |
| Detwiler Charles | $64,900 | -- |
Source: Public Records
Mortgage History
| Date | Status | Borrower | Loan Amount |
|---|---|---|---|
| Open | Detwiler Charles E | $170,940 | |
| Closed | Detwiler Charles | $101,250 |
Source: Public Records
Tax History Compared to Growth
Tax History
| Year | Tax Paid | Tax Assessment Tax Assessment Total Assessment is a certain percentage of the fair market value that is determined by local assessors to be the total taxable value of land and additions on the property. | Land | Improvement |
|---|---|---|---|---|
| 2025 | $2,337 | $32,964 | $1,400 | $31,564 |
| 2024 | $2,254 | $32,964 | $1,400 | $31,564 |
| 2022 | $2,062 | $25,917 | $1,453 | $24,464 |
| 2021 | $2,119 | $26,662 | $1,494 | $25,168 |
| 2020 | $1,887 | $23,738 | $1,494 | $22,244 |
| 2019 | $1,856 | $23,738 | $1,494 | $22,244 |
| 2018 | $1,757 | $21,348 | $1,505 | $19,843 |
| 2017 | $1,513 | $21,348 | $1,505 | $19,843 |
| 2016 | $1,281 | $17,465 | $1,664 | $15,801 |
| 2015 | $1,270 | $17,460 | $1,660 | $15,800 |
| 2014 | $1,038 | $13,810 | $1,660 | $12,150 |
Source: Public Records
Map
Nearby Homes
- 229 Blossom Dr
- 1786 Wintergreen Place
- 432 Glenda Dr
- 2120 3rd St SW Unit 1
- 332 Terri Dr
- 1725 Keyes Ct
- 2123 Lily Dr
- 677 Gayla Ct
- 628 Jocelyn Dr
- 621 Split Rock Dr
- 796 S Tyler Ave
- 825 Kaitlyn Cir
- 706 S Gilpin Ave
- 850 Gardenia Dr
- 2583 Begonia Ct
- 974 S Dotsero Dr
- 1560 10th St SW
- 827 S Buckeye Dr
- 874 S Buckeye Dr
- 1157 Lavender Ave