Estimated Value: $374,784
--
Bed
--
Bath
10,000
Sq Ft
$37/Sq Ft
Est. Value
About This Home
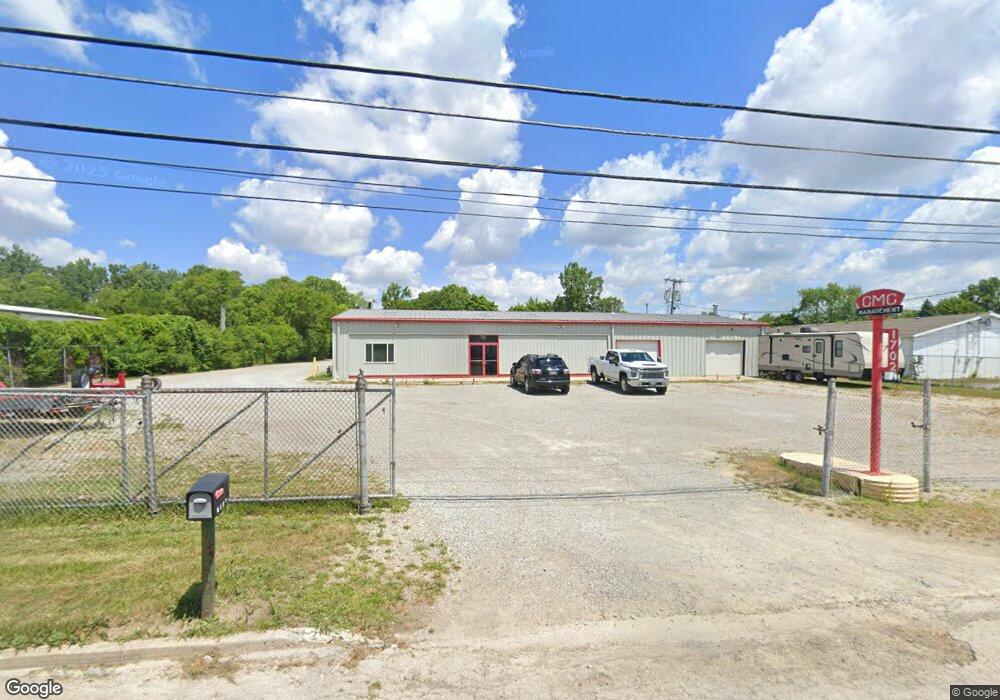
This home is located at 1702 Commerce Dr, Piqua, OH 45356 and is currently estimated at $374,784, approximately $37 per square foot. 1702 Commerce Dr is a home located in Miami County with nearby schools including Washington Primary School, Piqua Junior High School, and Piqua High School.
Ownership History
Date
Name
Owned For
Owner Type
Purchase Details
Closed on
Jan 7, 2025
Sold by
Cmc Management Llc
Bought by
Tri-City Property Group Llc
Current Estimated Value
Home Financials for this Owner
Home Financials are based on the most recent Mortgage that was taken out on this home.
Original Mortgage
$288,000
Outstanding Balance
$286,012
Interest Rate
6.84%
Mortgage Type
Credit Line Revolving
Estimated Equity
$88,772
Purchase Details
Closed on
Feb 22, 2013
Sold by
Mutual Federal Savings Bank
Bought by
Cmc Management Llc
Home Financials for this Owner
Home Financials are based on the most recent Mortgage that was taken out on this home.
Original Mortgage
$132,150
Interest Rate
3.38%
Mortgage Type
Future Advance Clause Open End Mortgage
Purchase Details
Closed on
Jan 14, 1992
Bought by
Fifth Third Bank Of
Create a Home Valuation Report for This Property
The Home Valuation Report is an in-depth analysis detailing your home's value as well as a comparison with similar homes in the area
Home Values in the Area
Average Home Value in this Area
Purchase History
| Date | Buyer | Sale Price | Title Company |
|---|---|---|---|
| Tri-City Property Group Llc | $360,000 | None Listed On Document | |
| Cmc Management Llc | $155,500 | Riverview Title Company | |
| Fifth Third Bank Of | -- | -- |
Source: Public Records
Mortgage History
| Date | Status | Borrower | Loan Amount |
|---|---|---|---|
| Open | Tri-City Property Group Llc | $288,000 | |
| Previous Owner | Cmc Management Llc | $132,150 |
Source: Public Records
Tax History Compared to Growth
Tax History
| Year | Tax Paid | Tax Assessment Tax Assessment Total Assessment is a certain percentage of the fair market value that is determined by local assessors to be the total taxable value of land and additions on the property. | Land | Improvement |
|---|---|---|---|---|
| 2024 | $2,794 | $46,340 | $24,430 | $21,910 |
| 2023 | $2,721 | $46,340 | $24,430 | $21,910 |
| 2022 | $2,822 | $46,340 | $24,430 | $21,910 |
| 2021 | $2,852 | $46,340 | $24,430 | $21,910 |
| 2020 | $2,827 | $46,340 | $24,430 | $21,910 |
| 2019 | $2,828 | $46,340 | $24,430 | $21,910 |
| 2018 | $3,303 | $54,430 | $21,980 | $32,450 |
| 2017 | $3,332 | $54,430 | $21,980 | $32,450 |
| 2016 | $3,304 | $54,430 | $21,980 | $32,450 |
| 2015 | $3,208 | $54,430 | $21,980 | $32,450 |
| 2014 | $3,208 | $54,430 | $21,980 | $32,450 |
| 2013 | $3,172 | $54,430 | $21,980 | $32,450 |
Source: Public Records
Map
Nearby Homes
- 210 Lyndhurst Dr
- 1435 Covington Ave
- 1821 Wilshire Dr
- 215 Levering Dr
- 513 Spotted Doe Trail
- 1271 Park Ave
- 403 Brentwood Ave
- 0 Robert M Davis Pkwy
- 1133 W Water St
- 806 Candlewood Blvd
- 1110 South St
- 809 Candlewood Blvd
- 1206 Echo Lake Dr
- 817 Washington Ave
- 1005 South St
- 3 Lake Ridge Dr
- 708 Brice Ave
- 1119 Anderson St