Estimated Value: $478,933 - $594,000
--
Bed
--
Bath
1,690
Sq Ft
$320/Sq Ft
Est. Value
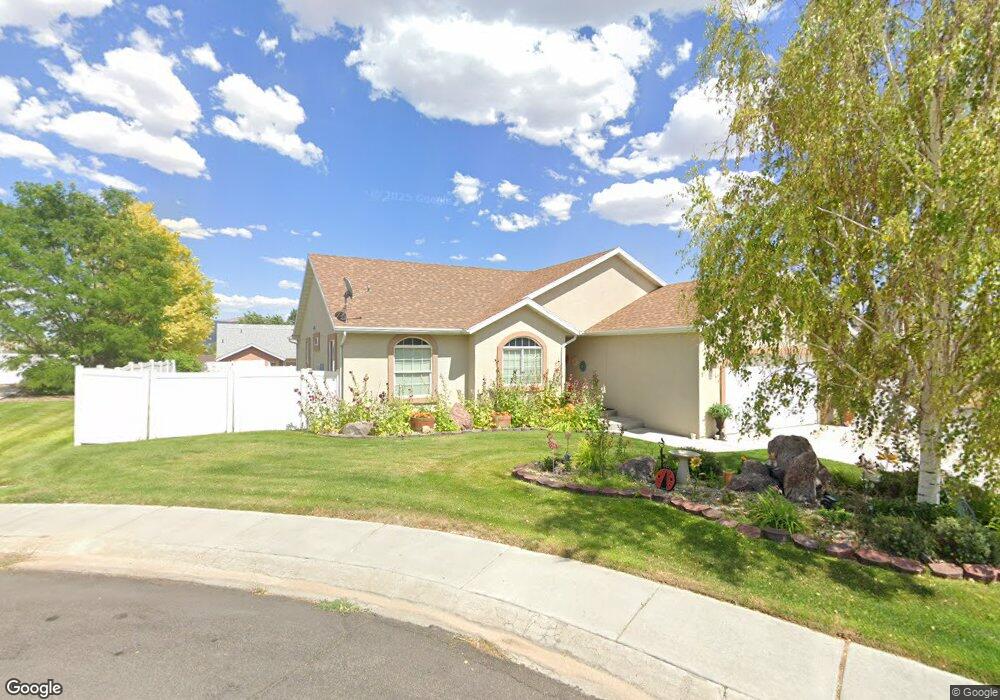
About This Home
This home is located at 1702 Joshua Cir, Elko, NV 89801 and is currently estimated at $541,483, approximately $320 per square foot. 1702 Joshua Cir is a home located in Elko County with nearby schools including Elko Grammar School #2, Flagview Intermediate School, and Adobe Middle School.
Ownership History
Date
Name
Owned For
Owner Type
Purchase Details
Closed on
May 18, 2021
Sold by
Lamourex Patricia R
Bought by
Lamoreux Patricia R and Kroupa Robin R
Current Estimated Value
Purchase Details
Closed on
Nov 13, 2015
Sold by
Lamoureux Michael L and Lamoureux Patrcia R
Bought by
Lamoureux Michael L and Lamoureux Patricia R
Home Financials for this Owner
Home Financials are based on the most recent Mortgage that was taken out on this home.
Original Mortgage
$272,000
Interest Rate
2.93%
Mortgage Type
New Conventional
Purchase Details
Closed on
Jun 6, 2011
Sold by
Wallace Squy G and Wallace Beatrice L
Bought by
Lamoureux Michael L and Miller Patricia R
Home Financials for this Owner
Home Financials are based on the most recent Mortgage that was taken out on this home.
Original Mortgage
$295,200
Interest Rate
4.55%
Mortgage Type
New Conventional
Create a Home Valuation Report for This Property
The Home Valuation Report is an in-depth analysis detailing your home's value as well as a comparison with similar homes in the area
Home Values in the Area
Average Home Value in this Area
Purchase History
| Date | Buyer | Sale Price | Title Company |
|---|---|---|---|
| Lamoreux Patricia R | -- | None Available | |
| Lamoureux Michael L | -- | Real Advantage Llc | |
| Lamoureux Michael L | $328,000 | Stewart Title Elko |
Source: Public Records
Mortgage History
| Date | Status | Borrower | Loan Amount |
|---|---|---|---|
| Previous Owner | Lamoureux Michael L | $272,000 | |
| Previous Owner | Lamoureux Michael L | $295,200 |
Source: Public Records
Tax History Compared to Growth
Tax History
| Year | Tax Paid | Tax Assessment Tax Assessment Total Assessment is a certain percentage of the fair market value that is determined by local assessors to be the total taxable value of land and additions on the property. | Land | Improvement |
|---|---|---|---|---|
| 2025 | $4,605 | $155,045 | $29,050 | $125,995 |
| 2024 | $4,605 | $143,580 | $15,750 | $127,830 |
| 2023 | $4,192 | $135,527 | $15,750 | $119,777 |
| 2022 | $4,070 | $117,414 | $15,750 | $101,664 |
| 2021 | $3,951 | $114,687 | $15,750 | $98,937 |
| 2020 | $3,836 | $117,193 | $15,750 | $101,443 |
| 2019 | $3,724 | $106,904 | $12,250 | $94,654 |
| 2018 | $3,736 | $107,251 | $12,250 | $95,001 |
| 2017 | $3,650 | $105,542 | $12,250 | $93,292 |
| 2016 | $3,543 | $105,043 | $12,250 | $92,793 |
| 2015 | $3,439 | $103,529 | $12,250 | $91,279 |
| 2014 | $3,340 | $98,967 | $12,250 | $86,717 |
Source: Public Records
Map
Nearby Homes
- 914 Country Club Dr
- 2081 Russell Dr
- 1873 Griswold Dr
- 201 Palmers Ct
- 2009 Eagle Dr Unit 3
- 2001 Eagle Dr Unit 1
- 2215 Ruby Vista Dr
- 1275 Ruby Vista Dr
- 2366 Khoury Ln
- 2426 Khoury Ln
- 2464 Puccinelli Pkwy
- 2405 Puccinelli Pkwy
- 2801 Incline Ave
- 2966 Lecomte Ct
- 0 13th St
- 2950 Lecomte Ct
- 2667 Mesquite Way
- 2678 Mesquite Way
- 2675 Mesquite Way
- 2686 Mesquite Way
- 1908 Ruby Vista Dr
- 1710 Joshua Cir
- 1703 Joshua Cir
- 1829 Sequoia Dr
- 1707 Joshua Cir
- 1825 Sequoia Dr
- 1821 Sequoia Dr
- 1711 Joshua Cir
- 1817 Sequoia Dr
- 1831 Sequoia Dr
- 1813 Sequoia Dr
- 1702 Sequoia Dr
- 1835 Sequoia Dr
- 1714 Sequoia Dr
- 1820 Sequoia Dr
- 1809 Sequoia Dr
- 1816 Sequoia Dr
- 1828 Sequoia Dr
- 1812 Sequoia Dr
- 1832 Sequoia Dr