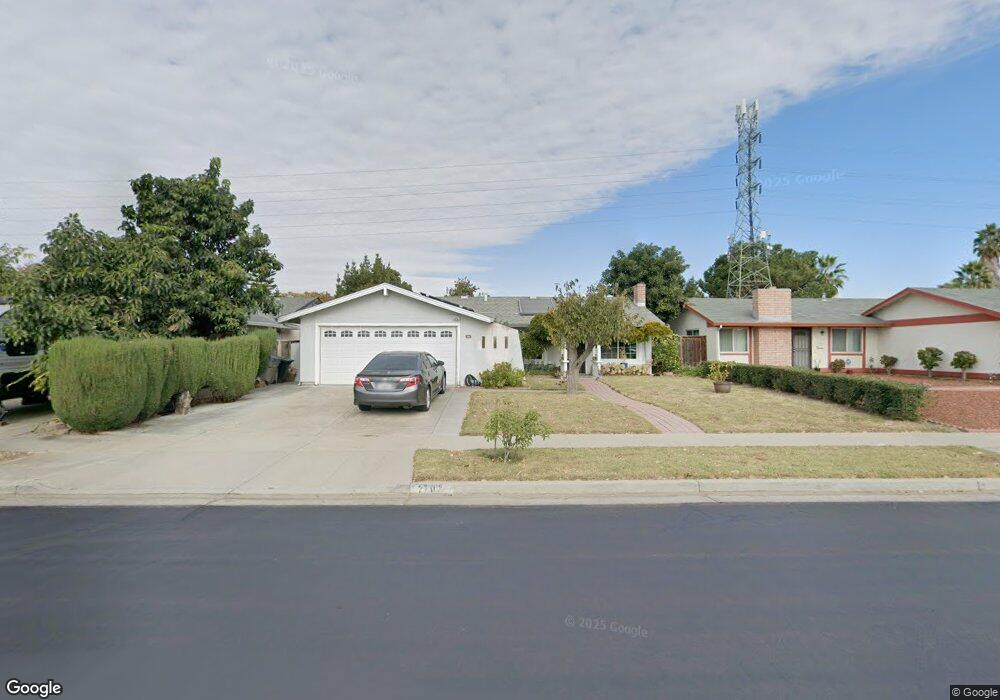
1702 Ramstree Dr San Jose, CA 95131
Brooktree NeighborhoodEstimated Value: $1,450,000 - $1,653,000
4
Beds
2
Baths
1,234
Sq Ft
$1,266/Sq Ft
Est. Value
About This Home
This home is located at 1702 Ramstree Dr, San Jose, CA 95131 and is currently estimated at $1,561,916, approximately $1,265 per square foot. 1702 Ramstree Dr is a home located in Santa Clara County with nearby schools including Brooktree Elementary School, Morrill Middle School, and Independence High School.
Ownership History
Date
Name
Owned For
Owner Type
Purchase Details
Closed on
Jun 28, 2012
Sold by
Eligado Roger D and Eligado Eunice B
Bought by
Eligado Roger D and Eligado Eunice B
Current Estimated Value
Purchase Details
Closed on
Dec 1, 2004
Sold by
Eligado Roger D and Eligado Eunice B
Bought by
Eligado Roger D and Eligado Eunice B
Home Financials for this Owner
Home Financials are based on the most recent Mortgage that was taken out on this home.
Original Mortgage
$315,000
Interest Rate
4.77%
Mortgage Type
Negative Amortization
Purchase Details
Closed on
Dec 19, 2000
Sold by
Eligado Roger D and Eligado Eunice B
Bought by
Eligado Roger D and Eligado Eunice B
Home Financials for this Owner
Home Financials are based on the most recent Mortgage that was taken out on this home.
Original Mortgage
$260,000
Interest Rate
7.71%
Purchase Details
Closed on
Sep 28, 1994
Sold by
Eligado Roger D and Eligado Eunice B
Bought by
Eligado Roger D and Eligado Eunice B
Create a Home Valuation Report for This Property
The Home Valuation Report is an in-depth analysis detailing your home's value as well as a comparison with similar homes in the area
Home Values in the Area
Average Home Value in this Area
Purchase History
| Date | Buyer | Sale Price | Title Company |
|---|---|---|---|
| Eligado Roger D | -- | None Available | |
| Eligado Roger D | -- | None Available | |
| Eligado Roger D | -- | Ticor Title Company | |
| Eligado Roger D | -- | Old Republic Title Company | |
| Eligado Roger D | -- | -- |
Source: Public Records
Mortgage History
| Date | Status | Borrower | Loan Amount |
|---|---|---|---|
| Closed | Eligado Roger D | $315,000 | |
| Closed | Eligado Roger D | $260,000 |
Source: Public Records
Tax History
| Year | Tax Paid | Tax Assessment Tax Assessment Total Assessment is a certain percentage of the fair market value that is determined by local assessors to be the total taxable value of land and additions on the property. | Land | Improvement |
|---|---|---|---|---|
| 2025 | $9,771 | $672,321 | $438,255 | $234,066 |
| 2024 | $9,771 | $659,139 | $429,662 | $229,477 |
| 2023 | $9,590 | $646,216 | $421,238 | $224,978 |
| 2022 | $9,548 | $633,546 | $412,979 | $220,567 |
| 2021 | $9,234 | $621,125 | $404,882 | $216,243 |
| 2020 | $8,945 | $614,757 | $400,731 | $214,026 |
| 2019 | $8,604 | $602,704 | $392,874 | $209,830 |
| 2018 | $8,479 | $590,887 | $385,171 | $205,716 |
| 2017 | $8,525 | $579,302 | $377,619 | $201,683 |
| 2016 | $8,170 | $567,944 | $370,215 | $197,729 |
| 2015 | $8,073 | $559,414 | $364,655 | $194,759 |
| 2014 | $7,389 | $548,456 | $357,512 | $190,944 |
Source: Public Records
Map
Nearby Homes
- 2280 Zoria Cir
- 1763 Flickinger Place Unit 28
- 1522 Fujiko Dr
- 2052 Purcell Place
- 2582 Minuet Dr
- 1984 Doxey Dr
- 1940 N Star Cir
- 1437 Marcello Dr
- 2162 Stratton Place
- 2427 Jubilee Ln
- 2501 Jubilee Ln
- 0 Lundy Ave
- 2559 Alveswood Cir
- 2380 Trade Zone Blvd
- 112 Morning Star Dr Unit 5
- 703 Star Jasmine Ct
- 2854 Agua Vista Dr
- 2838 Agua Vista Dr
- 1601 Adolfo Dr
- 1368 Goldenlake Rd
- 1694 Ramstree Dr
- 1710 Ramstree Dr
- 1688 Ramstree Dr
- 1718 Ramstree Dr
- 1705 Ramstree Dr
- 1697 Ramstree Dr
- 1680 Ramstree Dr
- 1724 Ramstree Dr
- 1713 Ramstree Dr
- 1691 Ramstree Dr
- 1719 Ramstree Dr
- 1683 Coraltree Place
- 1683 Ramstree Dr
- 1677 Coraltree Place
- 1672 Ramstree Dr
- 1732 Ramstree Dr
- 1689 Coraltree Place
- 1671 Coraltree Place
- 1695 Coraltree Place
- 1727 Ramstree Dr
Your Personal Tour Guide
Ask me questions while you tour the home.