NOT LISTED FOR SALE

1702 W Tiffany Ct Unit 4 Peoria, IL 61614

North Peoria Neighborhood

Estimated Value: $240,000 - $378,000

4 Beds
4 Baths
-- Sq Ft
0.34 Acres

Last Sold October 31, 2018

Last sale price $600

Est. 52,884% increase in value since last sale

Current estimated payment $2,309/month

357 Days on Market

About This Home

As of October 2018

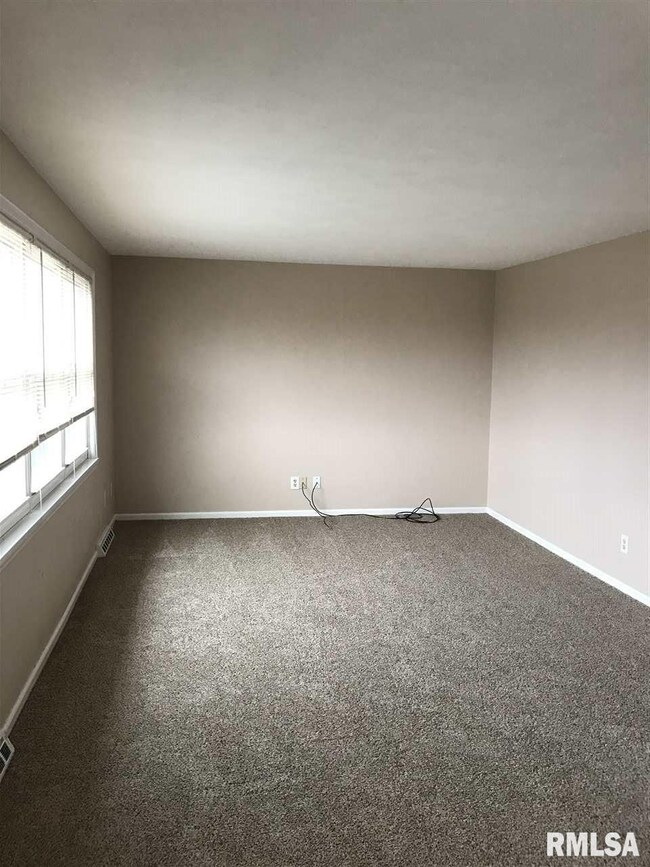
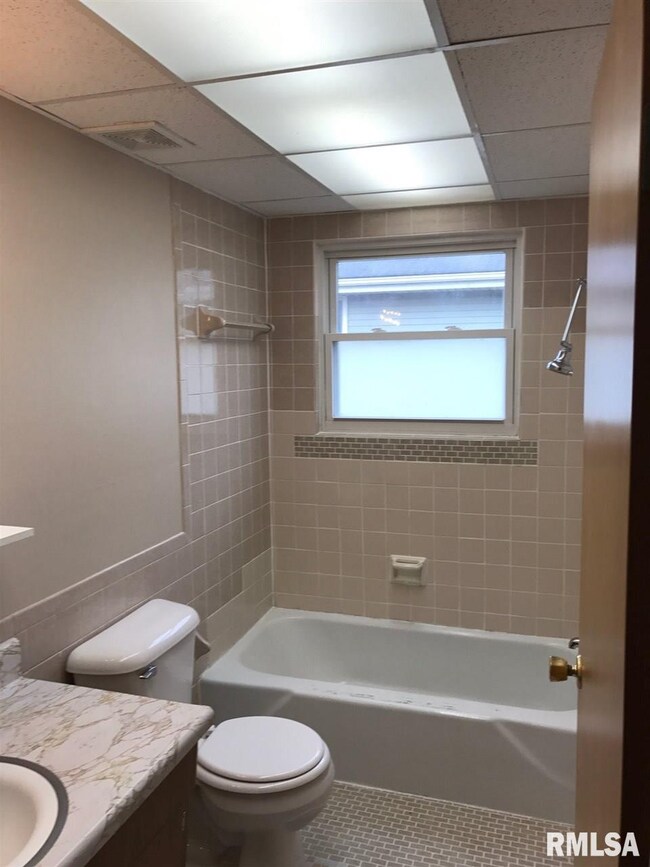
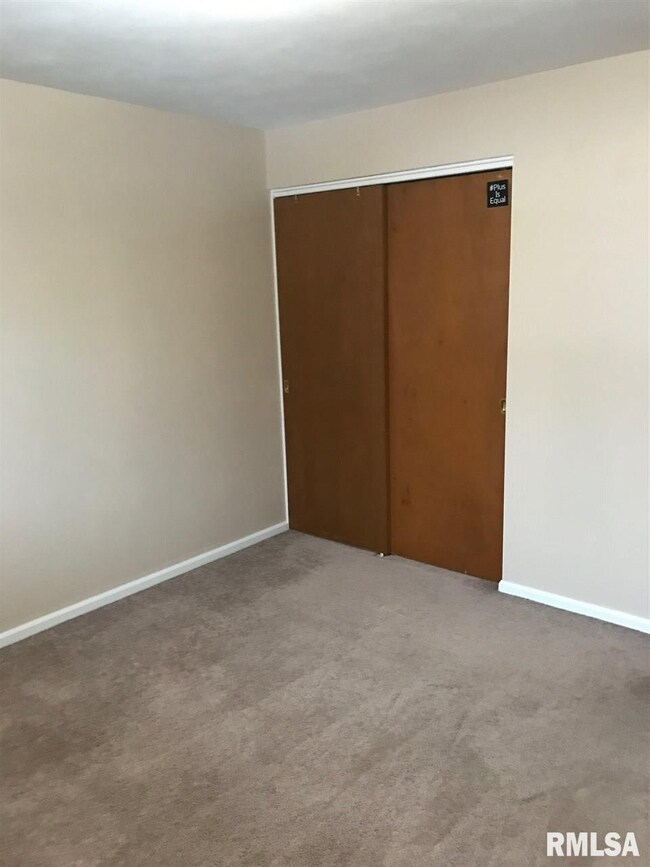
2 BEDROOM 1 BATH APARTMENT ON TIFFANY CT IN NORTH PEORIA. APARTMENT FEATURES DINING ROOM, LIVING ROOM AND KITCHEN WITH REFRIGERATOR, STOVE AND DISHWASHER. LOWER LEVEL COMMON LAUNDRY ROOM. INCLUDES GARAGE AND OPENER. EASY ACCESS TO UNIVERSITY ST AND I-474. CREDIT/BACKGROUND CHECK REQUIRED. $50 NON-REFUNDABLE APPLICATION PROCESSING FEE DUE AT TIME OF APPLICATION.

Last Agent to Sell the Property

Katie Kim

The Kim Group License #471020018 Listed on: 11/09/2016

Last Buyer's Agent

Katie Kim

The Kim Group License #471020018 Listed on: 11/09/2016

Property Details

Property Type

  • Other

Year Built

  • Built in 1968

Lot Details

  • 0.34

Utilities

  • Forced Air Heating and Cooling System
  • Heating System Uses Gas

Listing and Financial Details

  • Tenant pays for insurance, electric, heating, cooling
  • The owner pays for real estate taxes, insurance, structural maintenance, internal maintenance, common area, common area maintenance, trash, snow/lawn, water/sewer, management

Property Details

Property Type

Other

Year Built

Built in 1968

Lot Details

0

Listing Details

  • Class: Commercial/Cie
  • Type: Commercial/Cie
  • Style: Up & Down
  • Sub Type: Multi-Family
  • Lvt Date: 12/06/2016
  • Year Built: 1968
  • Handicap Modified: Yes
  • Special Features: None
  • Property Sub Type: Other

Interior Features

  • Flooring: Carpeted, Tile/Vinyl
  • Other Access: None
  • Estimated Lot Sq Ft: 14810

Exterior Features

  • Exterior Finish: Brick
  • Frontage Access: Paved 2Lane, Corner Lot, Cul-De-Sac
  • Insulation: Floors, Party Walls, Roof, Side Walls
  • Roof Construction: Comp Shingle
  • Wall Construction: Frame

Garage/Parking

  • Garages: Yes

Utilities

  • Cooling: Central Air
  • Heating: Forced Air, Gas
  • Water Supply: Municipal/City

Lot Info

  • Estimated Number of Acres: 0.34
  • Zoning: MULTI FAM
  • Geo Subdivision: IL

Rental Info

  • Monthly Lease Rate: 700
  • Lease Type: Gross
  • Owner Pays: Real Estate Taxes, Insurance, Structural Maintenance, Internal Maintenance, Common Area, Common Area Maint, Trash, Snow/Lawn, Water/Sewer, Management
  • Sale Lease Includes: Building
  • Tenant Pays: Insurance, Electric, Heating, Cooling
  • Terms Lease: Yearly

Tax Info

  • Annual Taxes: 6777
  • Parcel Id Number Tax Id: 14-08-301-008
  • Tax Incentive: None
  • Tax Year: 2014

Ownership History

Date Name Owned For Owner Type

Purchase Details

Closed on
Jan 25, 2018
Sold by
Thm Properties Llc
Bought by
Osorio & Mcadams Real Estate Rentals
Current Estimated Value
$317,902

Home Financials for this Owner

Home Financials are based on the most recent Mortgage that was taken out on this home.
Original Mortgage
$158,900
Outstanding Balance
$134,405
Interest Rate
3.94%
Mortgage Type
New Conventional
Estimated Equity
$183,497

Purchase Details

Closed on
Apr 30, 2014
Bought by
Nancy L Scurry Trust and Smith Patricia
Source: Public Records

Range of Values:

--
Value Increase
--
Percent Increase
--
Adjusted for Inflation
Collateral Analytics

Collateral Analytics Collateral Analytics AVMs (Automated Valuation Model) employ a number of statistical approaches combined with neighborhood-specific comparable selection guarantees the most up-to-date and precise valuations.

Not Available

Collateral Analytics does not have data for the current month. Please view the chart for historical values.

ICE

ICE Mortgage Technology ICE Mortgage Technology’s AVM (Automated Valuation Model) is a state-of-the-art online residential property valuation tool that provides a quick and accurate estimate of the value of almost any home in the U.S.

Not Available

ICE Mortgage Technology does not have data for the current month. Please view the chart for historical values.

First American

First American First American Data & Analytics’ next-generation AVM combines unrivaled data assets with a blended ensemble of valuation models to produce highly accurate, reliable valuations you can trust.

Not Available

First American does not have data for the current month. Please view the chart for historical values.

Quantarium

Quantarium Quantarium’s valuation service, repeatedly proven the industry’s most accurate and comprehensive, is supercharged with a self-learning and auto-tuning AI engine that continually becomes smarter and more accurate as it processes daily inputs from the industry’s leading RE data lake.

Not Available

Quantarium does not have data for the current month. Please view the chart for historical values.

Average Value
Not Available
List Price
Sold Price
Create a Home Valuation Report for This Property
The Home Valuation Report is an in-depth analysis detailing your home's value as well as a comparison with similar homes in the area

Home Values in the Area

Source: Public Records

Average Home Value in this Area


Source: Public Records

Purchase History

Date Buyer Sale Price Title Company
Osorio & Mcadams Real Estate Rentals $227,500 Chicago Title Co
Osorio & Mcadams Real Estate Ren $227,500 Chicago Title
Nancy L Scurry Trust $225,000 --
Source: Public Records

Mortgage History

Date Status Borrower Loan Amount
Open Osorio & Mcadams Real Estate Ren $158,900
Source: Public Records

Property History

Date Event Price List to Sale Price per Sq Ft
10/31/2018 10/31/18 Sold $600 -14.3% --
11/01/2017 11/01/17 Pending -- -- --
11/09/2016 11/09/16 For Sale $700 -- --
Source: RMLS Alliance

Tax History Compared to Growth

Source: Public Records

Tax History

Year Tax Paid Tax Assessment Tax Assessment Total Assessment is a certain percentage of the fair market value that is determined by local assessors to be the total taxable value of land and additions on the property. Land Improvement
2024 $7,663 $84,720 $15,330 $69,390
2023 $7,312 $77,720 $14,060 $63,660
2022 $7,583 $78,610 $13,100 $65,510
2021 $7,443 $74,870 $12,480 $62,390
2020 $7,428 $74,130 $12,360 $61,770
2019 $7,535 $75,640 $12,610 $63,030
2018 $7,372 $75,700 $12,730 $62,970
2017 $7,317 $76,470 $12,860 $63,610
2016 $7,167 $76,470 $12,860 $63,610
2015 $6,777 $74,970 $12,610 $62,360
2014 $6,777 $73,620 $12,310 $61,310
2013 -- $74,510 $12,460 $62,050
Source: Public Records

Agents Affiliated with this Home

  • Section Image
See All Agents

Map

Source: RMLS Alliance

MLS Number: RMAPA7032874

RMLS Alliance

APN: 14-08-301-008