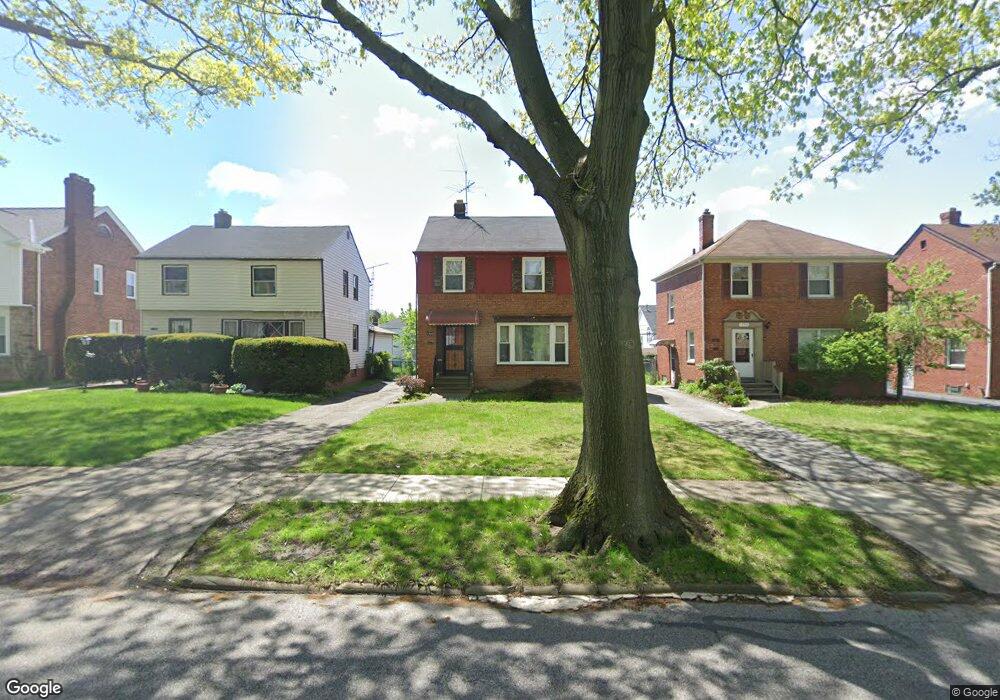
17020 Talford Ave Cleveland, OH 44128
Lee-Miles NeighborhoodEstimated Value: $120,437 - $135,000
3
Beds
1
Bath
1,196
Sq Ft
$108/Sq Ft
Est. Value
About This Home
This home is located at 17020 Talford Ave, Cleveland, OH 44128 and is currently estimated at $129,609, approximately $108 per square foot. 17020 Talford Ave is a home located in Cuyahoga County with nearby schools including Adlai Stevenson School, Andrew J. Rickoff School, and Bolton.
Ownership History
Date
Name
Owned For
Owner Type
Purchase Details
Closed on
Jun 5, 1996
Sold by
Bates Stephanie
Bought by
Cook Patrick O and Marbury Latonia
Current Estimated Value
Home Financials for this Owner
Home Financials are based on the most recent Mortgage that was taken out on this home.
Original Mortgage
$68,660
Outstanding Balance
$4,375
Interest Rate
7.97%
Mortgage Type
FHA
Estimated Equity
$125,234
Purchase Details
Closed on
Mar 15, 1991
Bought by
Bates Stephanie
Purchase Details
Closed on
Mar 6, 1990
Sold by
David Lee Green
Bought by
The Secretary Of Veterans
Purchase Details
Closed on
Mar 4, 1983
Bought by
David Lee Green
Purchase Details
Closed on
Feb 1, 1982
Bought by
Admin Veterans Affairs
Purchase Details
Closed on
Sep 25, 1979
Sold by
Mcclain Robert W
Bought by
Brewer Warren L
Purchase Details
Closed on
Oct 14, 1976
Sold by
Andrews Erma
Bought by
Mcclain Robert W
Purchase Details
Closed on
Jan 1, 1975
Bought by
Andrews Erma
Create a Home Valuation Report for This Property
The Home Valuation Report is an in-depth analysis detailing your home's value as well as a comparison with similar homes in the area
Home Values in the Area
Average Home Value in this Area
Purchase History
| Date | Buyer | Sale Price | Title Company |
|---|---|---|---|
| Cook Patrick O | $68,700 | -- | |
| Bates Stephanie | -- | -- | |
| The Secretary Of Veterans | -- | -- | |
| David Lee Green | -- | -- | |
| Admin Veterans Affairs | -- | -- | |
| St Joseph Mortgage Co Inc | $30,000 | -- | |
| Brewer Warren L | $42,900 | -- | |
| Mcclain Robert W | $31,000 | -- | |
| Andrews Erma | -- | -- |
Source: Public Records
Mortgage History
| Date | Status | Borrower | Loan Amount |
|---|---|---|---|
| Open | Cook Patrick O | $68,660 |
Source: Public Records
Tax History Compared to Growth
Tax History
| Year | Tax Paid | Tax Assessment Tax Assessment Total Assessment is a certain percentage of the fair market value that is determined by local assessors to be the total taxable value of land and additions on the property. | Land | Improvement |
|---|---|---|---|---|
| 2024 | $3,162 | $48,230 | $7,945 | $40,285 |
| 2023 | $2,360 | $31,120 | $7,070 | $24,050 |
| 2022 | $2,347 | $31,120 | $7,070 | $24,050 |
| 2021 | $2,323 | $31,120 | $7,070 | $24,050 |
| 2020 | $2,298 | $26,600 | $6,060 | $20,550 |
| 2019 | $2,125 | $76,000 | $17,300 | $58,700 |
| 2018 | $2,034 | $26,600 | $6,060 | $20,550 |
| 2017 | $1,966 | $23,840 | $7,530 | $16,310 |
| 2016 | $1,951 | $23,840 | $7,530 | $16,310 |
| 2015 | $1,921 | $23,840 | $7,530 | $16,310 |
| 2014 | $1,921 | $23,390 | $7,390 | $16,000 |
Source: Public Records
Map
Nearby Homes
- 17016 Talford Ave
- 17120 Talford Ave
- 16915 Talford Ave
- 17302 Glendale Ave
- 17211 Walden Ave
- 17104 Throckley Ave
- 17312 Glendale Ave
- 17008 Throckley Ave
- 17015 Stockbridge Ave
- 16702 Glendale Ave
- 17415 Talford Ave
- 17416 Throckley Ave
- 17403 Stockbridge Ave
- 17425 Walden Ave
- 17604 Walden Ave
- 17020 Eldamere Ave
- 17511 Throckley Ave
- 17426 Invermere Ave
- 3927 E 176th St
- 3855 E 177th St
- 17104 Talford Ave
- 17108 Talford Ave
- 17012 Talford Ave
- 17008 Talford Ave
- 17112 Talford Ave
- 17019 Glendale Ave
- 17103 Glendale Ave
- 17015 Glendale Ave
- 17011 Glendale Ave
- 17116 Talford Ave
- 17004 Talford Ave
- 17007 Glendale Ave
- 17111 Glendale Ave
- 17019 Talford Ave
- 17103 Talford Ave
- 17015 Talford Ave
- 17107 Talford Ave
- 17011 Talford Ave
- 16920 Talford Ave
- 17115 Glendale Ave