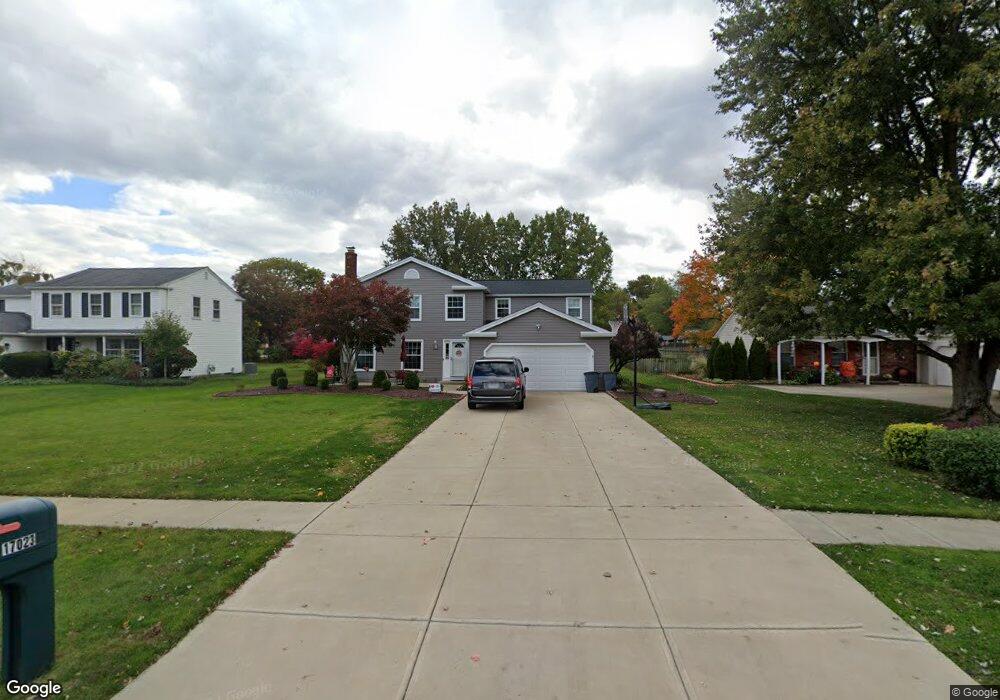
17023 Raccoon Trail Strongsville, OH 44136
Estimated Value: $367,060 - $427,000
4
Beds
3
Baths
2,632
Sq Ft
$150/Sq Ft
Est. Value
About This Home
This home is located at 17023 Raccoon Trail, Strongsville, OH 44136 and is currently estimated at $393,515, approximately $149 per square foot. 17023 Raccoon Trail is a home located in Cuyahoga County with nearby schools including Strongsville High School and Sts Joseph & John Interparochial School.
Ownership History
Date
Name
Owned For
Owner Type
Purchase Details
Closed on
May 6, 2010
Sold by
Jin Gang Simon and Jin Lili W
Bought by
Wilke William H and Wilke Darlene M
Current Estimated Value
Home Financials for this Owner
Home Financials are based on the most recent Mortgage that was taken out on this home.
Original Mortgage
$186,558
Outstanding Balance
$125,470
Interest Rate
5.12%
Mortgage Type
FHA
Estimated Equity
$268,045
Purchase Details
Closed on
Dec 29, 1995
Sold by
Nandra Charn S
Bought by
Simon Gang and Jin Lili Wang
Home Financials for this Owner
Home Financials are based on the most recent Mortgage that was taken out on this home.
Original Mortgage
$126,200
Interest Rate
7.01%
Mortgage Type
New Conventional
Purchase Details
Closed on
Jun 22, 1992
Sold by
Ryan John M
Bought by
Nandra Charn S
Purchase Details
Closed on
Mar 17, 1976
Bought by
Ryan John M
Purchase Details
Closed on
Jan 1, 1975
Bought by
J D Land Co
Create a Home Valuation Report for This Property
The Home Valuation Report is an in-depth analysis detailing your home's value as well as a comparison with similar homes in the area
Home Values in the Area
Average Home Value in this Area
Purchase History
| Date | Buyer | Sale Price | Title Company |
|---|---|---|---|
| Wilke William H | $190,000 | Newman Title | |
| Simon Gang | $157,750 | -- | |
| Nandra Charn S | $154,500 | -- | |
| Ryan John M | $58,400 | -- | |
| J D Land Co | -- | -- |
Source: Public Records
Mortgage History
| Date | Status | Borrower | Loan Amount |
|---|---|---|---|
| Open | Wilke William H | $186,558 | |
| Closed | Simon Gang | $126,200 |
Source: Public Records
Tax History Compared to Growth
Tax History
| Year | Tax Paid | Tax Assessment Tax Assessment Total Assessment is a certain percentage of the fair market value that is determined by local assessors to be the total taxable value of land and additions on the property. | Land | Improvement |
|---|---|---|---|---|
| 2024 | $5,076 | $108,115 | $22,295 | $85,820 |
| 2023 | $5,223 | $83,410 | $18,830 | $64,580 |
| 2022 | $5,185 | $83,410 | $18,830 | $64,580 |
| 2021 | $5,144 | $83,410 | $18,830 | $64,580 |
| 2020 | $4,765 | $68,360 | $15,440 | $52,920 |
| 2019 | $4,626 | $195,300 | $44,100 | $151,200 |
| 2018 | $4,178 | $68,360 | $15,440 | $52,920 |
| 2017 | $4,236 | $63,850 | $12,430 | $51,420 |
| 2016 | $4,201 | $63,850 | $12,430 | $51,420 |
| 2015 | $4,261 | $63,850 | $12,430 | $51,420 |
| 2014 | $4,261 | $63,850 | $12,430 | $51,420 |
Source: Public Records
Map
Nearby Homes
- 17069 Partridge Dr
- 18162 Fawn Cir
- 17024 Bear Creek Ln
- 16650 Lanier Ave
- 17159 Turkey Meadow Ln
- 17682 Drake Rd
- 18294 Drake Rd
- 18630 Shurmer Rd
- 17934 Cambridge Oval
- 16450 Howe Rd
- 19311 Bradford Ct
- 15639 Indianhead Ln
- 19297 Lauren Way
- 16486 S Red Rock Dr
- 17259 Woodshire Dr
- 18411 Yorktown Oval
- 17130 Golden Star Dr
- 14826 Lenox Dr
- 14703 Lenox Dr Unit 103
- 19513 Lunn Rd
- 17027 Raccoon Trail
- 17021 Raccoon Trail
- 17005 Deer Path Dr
- 17031 Raccoon Trail
- 16020 Squirrel Hollow Ln
- 17003 Deer Path Dr
- 17015 Deer Path Dr
- 16022 Squirrel Hollow Ln
- 17024 Raccoon Trail
- 17001 Deer Path Dr
- 17028 Raccoon Trail
- 17002 Deer Path Dr
- 17006 Deer Path Dr
- 16024 Squirrel Hollow Ln
- 17021 Deer Path Dr
- 17000 Deer Path Dr
- 17032 Raccoon Trail
- 17010 Deer Path Dr
- 17035 Raccoon Trail
- 16998 Deer Path Dr