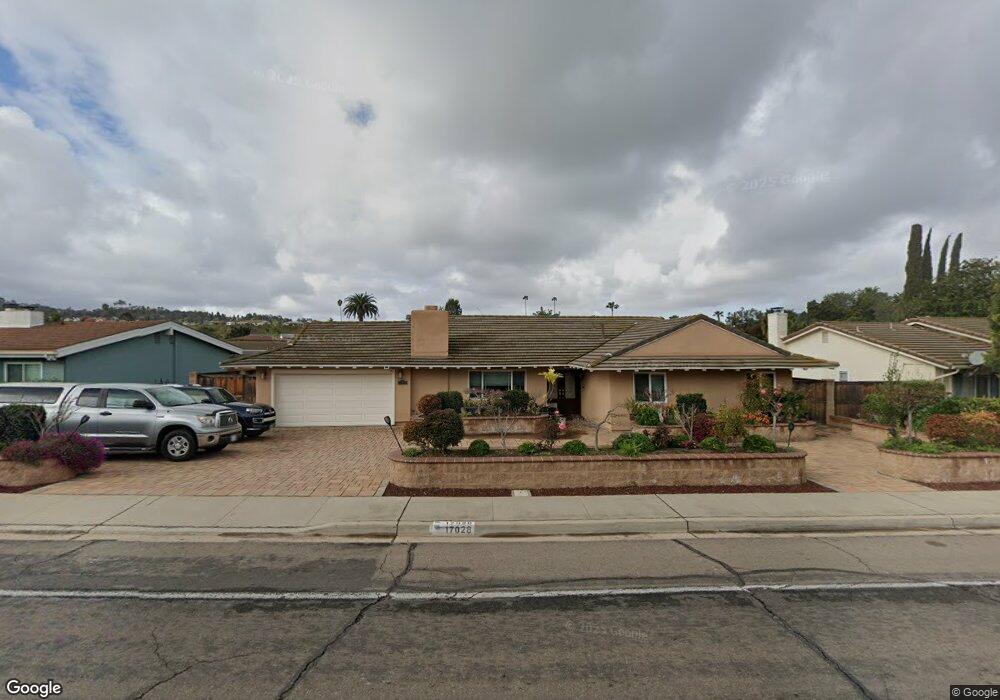
17028 Bernardo Oaks Dr San Diego, CA 92128
Rancho Bernardo NeighborhoodEstimated Value: $1,245,077 - $1,527,000
4
Beds
2
Baths
2,079
Sq Ft
$646/Sq Ft
Est. Value
About This Home
This home is located at 17028 Bernardo Oaks Dr, San Diego, CA 92128 and is currently estimated at $1,342,769, approximately $645 per square foot. 17028 Bernardo Oaks Dr is a home located in San Diego County with nearby schools including Chaparral Elementary, Bernardo Heights Middle, and Rancho Bernardo High.
Ownership History
Date
Name
Owned For
Owner Type
Purchase Details
Closed on
Oct 20, 2014
Sold by
Johnson Craig T
Bought by
Teruya Nancy D and Teruya Paul L
Current Estimated Value
Home Financials for this Owner
Home Financials are based on the most recent Mortgage that was taken out on this home.
Original Mortgage
$410,000
Outstanding Balance
$315,017
Interest Rate
4.16%
Mortgage Type
New Conventional
Estimated Equity
$1,027,752
Purchase Details
Closed on
Dec 22, 2009
Sold by
Johnson Craig T
Bought by
Johnson Craig T
Purchase Details
Closed on
Jun 16, 2000
Sold by
Johnson Barbara M Trust 05-29-86 and Craig T
Bought by
Barbara M Johnson Family Partnership Lp
Purchase Details
Closed on
Jun 20, 1985
Create a Home Valuation Report for This Property
The Home Valuation Report is an in-depth analysis detailing your home's value as well as a comparison with similar homes in the area
Home Values in the Area
Average Home Value in this Area
Purchase History
| Date | Buyer | Sale Price | Title Company |
|---|---|---|---|
| Teruya Nancy D | $610,000 | Title 365 | |
| Johnson Craig T | -- | None Available | |
| Johnson Craig T | -- | None Available | |
| Johnson Craig T | -- | None Available | |
| Barbara M Johnson Family Partnership Lp | -- | -- | |
| Johnson Craig T | -- | -- | |
| -- | $147,500 | -- |
Source: Public Records
Mortgage History
| Date | Status | Borrower | Loan Amount |
|---|---|---|---|
| Open | Teruya Nancy D | $410,000 |
Source: Public Records
Tax History Compared to Growth
Tax History
| Year | Tax Paid | Tax Assessment Tax Assessment Total Assessment is a certain percentage of the fair market value that is determined by local assessors to be the total taxable value of land and additions on the property. | Land | Improvement |
|---|---|---|---|---|
| 2025 | $6,236 | $733,118 | $333,667 | $399,451 |
| 2024 | $6,236 | $718,744 | $327,125 | $391,619 |
| 2023 | $6,164 | $704,652 | $320,711 | $383,941 |
| 2022 | $6,151 | $690,836 | $314,423 | $376,413 |
| 2021 | $6,066 | $677,291 | $308,258 | $369,033 |
| 2020 | $6,015 | $670,348 | $305,098 | $365,250 |
| 2019 | $5,871 | $657,205 | $299,116 | $358,089 |
| 2018 | $9,403 | $644,319 | $293,251 | $351,068 |
| 2017 | $83 | $631,686 | $287,501 | $344,185 |
| 2016 | $10,489 | $619,301 | $281,864 | $337,437 |
| 2015 | $6,713 | $610,000 | $277,631 | $332,369 |
| 2014 | $3,559 | $318,856 | $145,122 | $173,734 |
Source: Public Records
Map
Nearby Homes
- 12215 Santiago Rd W Unit Santiago
- 16859 Acebo Dr
- 16924 Bellota Dr
- 12094 Caminito Campana
- 16866 Acebo Dr
- 12093 Caminito Campana
- 16881 Bellota Dr
- 12553 Caminito de la Gallarda
- 12567 Pomerado Ct Unit 1
- 16856 Bellota Dr
- 16846 Dominican Dr Unit 4
- 12031 Caminito Cadena
- 16660 Roca Dr
- 11984 Rancho Bernardo Rd Unit J
- 16632 Roca Dr Unit 41
- 16799 Acena Dr
- 12424 Rios Rd
- 16710 Obispo Ln
- 17071 Bernardo Center Dr Unit A
- 16556 Gabarda Rd
- 17042 Bernardo Oaks Dr
- 12260 Frontera Rd
- 12248 Frontera Rd
- 12272 Frontera Rd
- 17052 Bernardo Oaks Dr
- 17008 Bernardo Oaks Dr
- 17025 Bernardo Oaks Dr
- 17035 Bernardo Oaks Dr
- 17045 Bernardo Oaks Dr
- 17015 Bernardo Oaks Dr
- 12236 Frontera Rd
- 17062 Bernardo Oaks Dr
- 17055 Bernardo Oaks Dr
- 17005 Bernardo Oaks Dr
- 12265 Frontera Rd
- 12255 Frontera Rd
- 12275 Frontera Rd
- 12285 Frontera Rd
- 17065 Bernardo Oaks Dr
- 12245 Frontera Rd