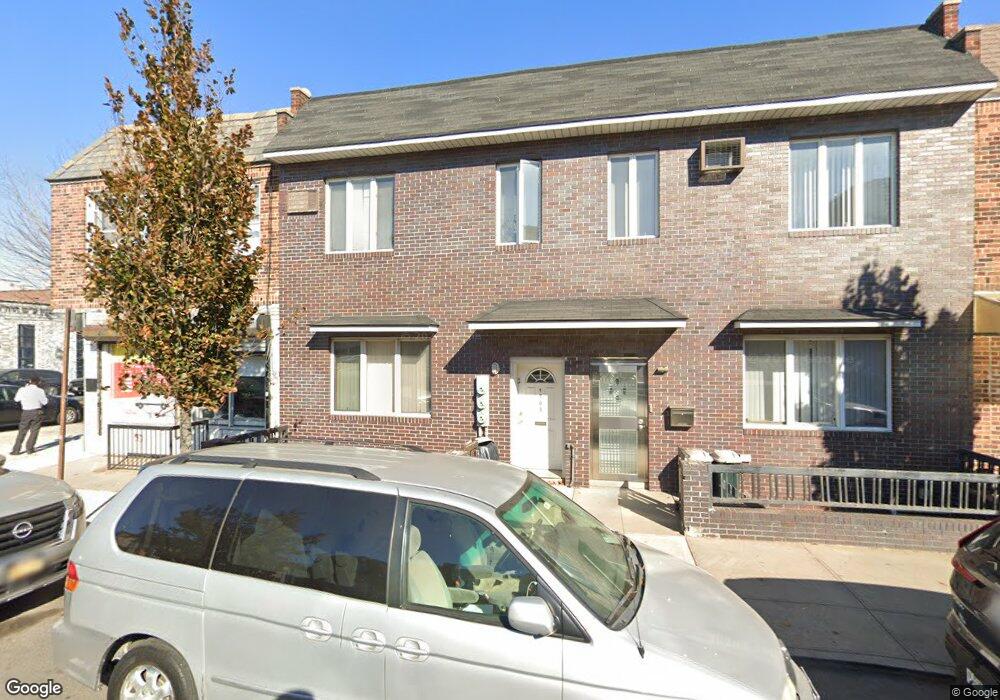
1703 62nd St Brooklyn, NY 11204
Mapleton NeighborhoodEstimated Value: $1,201,128 - $1,622,000
--
Bed
--
Bath
1,872
Sq Ft
$748/Sq Ft
Est. Value
About This Home
This home is located at 1703 62nd St, Brooklyn, NY 11204 and is currently estimated at $1,399,782, approximately $747 per square foot. 1703 62nd St is a home located in Kings County with nearby schools including P.S. 048 Mapleton, Junior High School 227 Edward B Shallow, and Franklin Delano Roosevelt High School.
Ownership History
Date
Name
Owned For
Owner Type
Purchase Details
Closed on
Dec 19, 2023
Sold by
Zhong Mei Zhen
Bought by
Lu Wan Yu
Current Estimated Value
Purchase Details
Closed on
Oct 7, 2009
Sold by
Tempera Gina and Tempera Michael
Bought by
Zhong Mei Zhen
Purchase Details
Closed on
Nov 14, 2005
Sold by
Mongelli Frank
Bought by
Tempera Gina and Tempera Michael A
Home Financials for this Owner
Home Financials are based on the most recent Mortgage that was taken out on this home.
Original Mortgage
$50,000
Interest Rate
6.06%
Purchase Details
Closed on
Feb 1, 1997
Sold by
Mongelli Donna and Esposito Donna
Bought by
Mongelli Frank
Home Financials for this Owner
Home Financials are based on the most recent Mortgage that was taken out on this home.
Original Mortgage
$105,000
Interest Rate
7.86%
Mortgage Type
Purchase Money Mortgage
Create a Home Valuation Report for This Property
The Home Valuation Report is an in-depth analysis detailing your home's value as well as a comparison with similar homes in the area
Home Values in the Area
Average Home Value in this Area
Purchase History
| Date | Buyer | Sale Price | Title Company |
|---|---|---|---|
| Lu Wan Yu | -- | -- | |
| Lu Wan Yu | -- | -- | |
| Zhong Mei Zhen | $658,000 | -- | |
| Zhong Mei Zhen | $658,000 | -- | |
| Tempera Gina | $500,000 | -- | |
| Tempera Gina | $500,000 | -- | |
| Mongelli Frank | $39,000 | Stewart Title Insurance Co | |
| Mongelli Frank | -- | Stewart Title Insurance Co |
Source: Public Records
Mortgage History
| Date | Status | Borrower | Loan Amount |
|---|---|---|---|
| Previous Owner | Tempera Gina | $50,000 | |
| Previous Owner | Tempera Gina | $400,000 | |
| Previous Owner | Mongelli Frank | $105,000 |
Source: Public Records
Tax History Compared to Growth
Tax History
| Year | Tax Paid | Tax Assessment Tax Assessment Total Assessment is a certain percentage of the fair market value that is determined by local assessors to be the total taxable value of land and additions on the property. | Land | Improvement |
|---|---|---|---|---|
| 2025 | $6,677 | $79,080 | $12,180 | $66,900 |
| 2024 | $6,677 | $62,460 | $12,180 | $50,280 |
| 2023 | $6,751 | $65,700 | $12,180 | $53,520 |
| 2022 | $6,586 | $63,300 | $12,180 | $51,120 |
| 2021 | $6,550 | $69,240 | $12,180 | $57,060 |
| 2020 | $3,072 | $57,600 | $12,180 | $45,420 |
| 2019 | $5,795 | $57,600 | $12,180 | $45,420 |
| 2018 | $5,647 | $27,702 | $6,585 | $21,117 |
| 2017 | $5,604 | $27,492 | $7,286 | $20,206 |
| 2016 | $5,185 | $25,936 | $6,656 | $19,280 |
| 2015 | $3,128 | $24,469 | $7,460 | $17,009 |
| 2014 | $3,128 | $23,085 | $6,625 | $16,460 |
Source: Public Records
Map
Nearby Homes
- 1710 62nd St
- 1718 63rd St
- 1762 64th St
- 1833 64th St
- 1807 66th St Unit 4E
- 1807 66th St Unit 7a
- 1807 66th St Unit 5B
- 1807 66th St Unit 4C
- 1807 66th St Unit 3D
- 6610 17th Ave
- 1856 60th St
- 6623 Wallaston Ct
- 6109 19th Ave
- 1725 68th St Unit 2F
- 1725 68th St Unit 1F
- 1725 68th St Unit 3R
- 1725 68th St Unit 2R
- 1725 68th St Unit 5
- 1863 66th St
- 6421 19th Ave