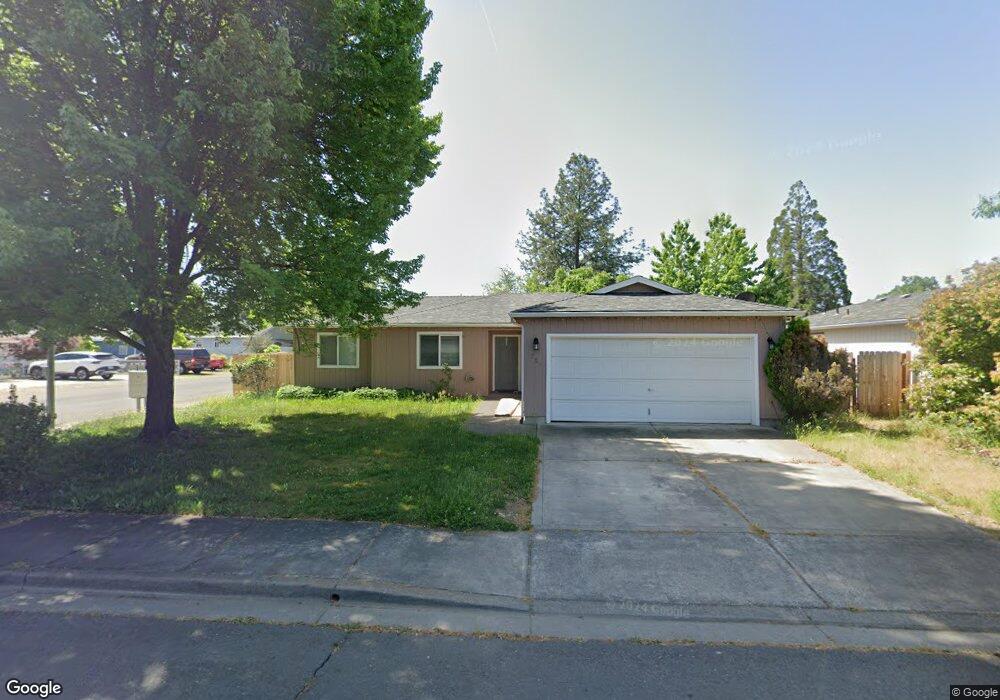
1703 Farr St Medford, OR 97501
Washington NeighborhoodEstimated Value: $331,000 - $355,908
3
Beds
2
Baths
1,349
Sq Ft
$256/Sq Ft
Est. Value
About This Home
This home is located at 1703 Farr St, Medford, OR 97501 and is currently estimated at $345,977, approximately $256 per square foot. 1703 Farr St is a home located in Jackson County with nearby schools including Oak Grove Elementary School, McLoughlin Middle School, and South Medford High School.
Ownership History
Date
Name
Owned For
Owner Type
Purchase Details
Closed on
Mar 6, 2024
Sold by
Cedillo Juvenal Nunez and Romero Navelit Ortega
Bought by
Nunez Antonio Herrera
Current Estimated Value
Purchase Details
Closed on
Dec 9, 2021
Sold by
Nunez Antonio Herrera
Bought by
Nunez Antonio Herrera and Cedillo Juvenal Nunez
Purchase Details
Closed on
Jul 14, 2021
Sold by
Caswell Roger and Caswell Debra
Bought by
Nunez Antonio Herrera
Home Financials for this Owner
Home Financials are based on the most recent Mortgage that was taken out on this home.
Original Mortgage
$264,000
Interest Rate
2.96%
Mortgage Type
New Conventional
Purchase Details
Closed on
Oct 30, 2020
Sold by
Caswell Trust and Caswell Roger A
Bought by
Caswell Roger and Caswell Debra
Purchase Details
Closed on
Jul 29, 2002
Sold by
Burns Allen K and Burns Susan K
Bought by
Caswell Edwin B and Caswell Mary E
Create a Home Valuation Report for This Property
The Home Valuation Report is an in-depth analysis detailing your home's value as well as a comparison with similar homes in the area
Home Values in the Area
Average Home Value in this Area
Purchase History
| Date | Buyer | Sale Price | Title Company |
|---|---|---|---|
| Nunez Antonio Herrera | -- | None Listed On Document | |
| Nunez Antonio Herrera | -- | None Available | |
| Nunez Antonio Herrera | $335,000 | Ticor Title | |
| Caswell Roger | -- | None Listed On Document | |
| Caswell Edwin B | $141,900 | Key Title Company |
Source: Public Records
Mortgage History
| Date | Status | Borrower | Loan Amount |
|---|---|---|---|
| Previous Owner | Nunez Antonio Herrera | $264,000 |
Source: Public Records
Tax History Compared to Growth
Tax History
| Year | Tax Paid | Tax Assessment Tax Assessment Total Assessment is a certain percentage of the fair market value that is determined by local assessors to be the total taxable value of land and additions on the property. | Land | Improvement |
|---|---|---|---|---|
| 2025 | $2,782 | $186,830 | $58,500 | $128,330 |
| 2024 | $2,782 | $181,390 | $56,790 | $124,600 |
| 2023 | $2,627 | $176,110 | $55,140 | $120,970 |
| 2022 | $2,563 | $176,110 | $55,140 | $120,970 |
| 2021 | $2,496 | $170,990 | $53,530 | $117,460 |
| 2020 | $2,444 | $166,010 | $51,980 | $114,030 |
| 2019 | $2,386 | $156,490 | $48,990 | $107,500 |
| 2018 | $2,325 | $151,940 | $47,560 | $104,380 |
| 2017 | $2,283 | $151,940 | $47,560 | $104,380 |
| 2016 | $2,298 | $143,230 | $44,830 | $98,400 |
| 2015 | $2,209 | $143,230 | $44,830 | $98,400 |
| 2014 | $2,170 | $135,010 | $42,250 | $92,760 |
Source: Public Records
Map
Nearby Homes
- 321 Jeanette Ave
- 540 Jeanette Ave
- 430 -432 S Columbus Ave
- 400 -432 S Columbus Ave
- 424 -426 S Columbus Ave
- 420
- 410 -412 S Columbus Ave
- 400 -402 S Columbus Ave
- 1500 Prune St
- 634 Colinwood Ct
- 502 Benson St
- 124 S Columbus Ave
- 437 Benson St
- 38 Lewis Ave
- 32 Chestnut Ave
- 223 New Spirit Way Unit Lot 19
- 219 New Spirit Way Unit Lot 20
- 215 New Spirit Way Unit Lot 21
- 211 New Spirit Way Unit Lot 22
- 1217 Murray Ave
- 390 Jeanette Ave
- 1711 Farr St
- 1702 Farr St
- 352 Jeanette Ave
- 1721 Farr St
- 1700 Prune St Unit 2
- 1700 Prune St Unit 1
- 1700 Prune St
- 323 Jeanette Ave
- 325 Jeanette Ave
- 319 Jeanette Ave
- 1712 Farr St
- 314 Jeanette Ave
- 1620 Prune St
- 1731 Farr St
- 317 Jeanette Ave
- 1610 Prune St
- 1704 Prune St
- 0 Prune St
- 1732 Farr St