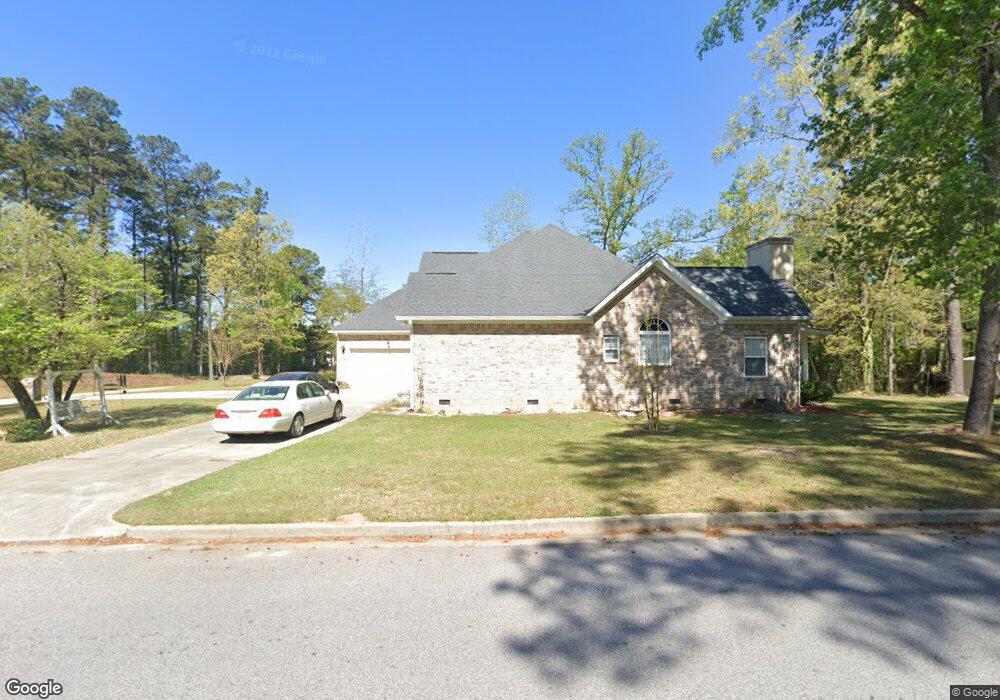
1703 Flagler Rd Augusta, GA 30909
Belair NeighborhoodEstimated Value: $434,000 - $495,000
4
Beds
4
Baths
3,677
Sq Ft
$125/Sq Ft
Est. Value
About This Home
This home is located at 1703 Flagler Rd, Augusta, GA 30909 and is currently estimated at $460,464, approximately $125 per square foot. 1703 Flagler Rd is a home located in Richmond County with nearby schools including Johnson Magnet, Westside High School, and Greater Augusta Christian Academy.
Ownership History
Date
Name
Owned For
Owner Type
Purchase Details
Closed on
Aug 25, 2021
Sold by
Cummings Moses
Bought by
Cummings Moses and Cummings Irene
Current Estimated Value
Purchase Details
Closed on
May 24, 2005
Sold by
Inman Rosa L
Bought by
Cummings Moses
Home Financials for this Owner
Home Financials are based on the most recent Mortgage that was taken out on this home.
Original Mortgage
$256,800
Interest Rate
5.45%
Mortgage Type
Fannie Mae Freddie Mac
Purchase Details
Closed on
Mar 15, 2002
Sold by
Briscoe Curtis
Bought by
Inman Rosa L
Purchase Details
Closed on
Nov 29, 2000
Sold by
Powell Kelvin B
Bought by
Briscoe Curtis A
Home Financials for this Owner
Home Financials are based on the most recent Mortgage that was taken out on this home.
Original Mortgage
$15,000
Interest Rate
7.75%
Purchase Details
Closed on
May 12, 1994
Sold by
Beard Terry C
Bought by
Powell Kelvin B
Create a Home Valuation Report for This Property
The Home Valuation Report is an in-depth analysis detailing your home's value as well as a comparison with similar homes in the area
Home Values in the Area
Average Home Value in this Area
Purchase History
| Date | Buyer | Sale Price | Title Company |
|---|---|---|---|
| Cummings Moses | -- | -- | |
| Cummings Moses | $321,000 | -- | |
| Inman Rosa L | $23,000 | -- | |
| Briscoe Curtis A | $20,000 | -- | |
| Powell Kelvin B | -- | -- |
Source: Public Records
Mortgage History
| Date | Status | Borrower | Loan Amount |
|---|---|---|---|
| Previous Owner | Cummings Moses | $256,800 | |
| Previous Owner | Briscoe Curtis A | $15,000 | |
| Closed | Cummings Moses | $64,200 |
Source: Public Records
Tax History
| Year | Tax Paid | Tax Assessment Tax Assessment Total Assessment is a certain percentage of the fair market value that is determined by local assessors to be the total taxable value of land and additions on the property. | Land | Improvement |
|---|---|---|---|---|
| 2025 | $2,809 | $208,860 | $12,000 | $196,860 |
| 2024 | $2,809 | $187,220 | $12,000 | $175,220 |
| 2023 | $2,281 | $189,472 | $12,000 | $177,472 |
| 2022 | $1,890 | $155,110 | $12,000 | $143,110 |
| 2021 | $2,026 | $153,938 | $12,000 | $141,938 |
| 2020 | $1,754 | $135,424 | $12,000 | $123,424 |
| 2019 | $2,006 | $135,424 | $12,000 | $123,424 |
| 2018 | $2,118 | $133,866 | $12,000 | $121,866 |
| 2017 | $2,213 | $133,866 | $12,000 | $121,866 |
| 2016 | $2,327 | $133,790 | $12,000 | $121,790 |
| 2015 | $2,451 | $133,790 | $12,000 | $121,790 |
| 2014 | $2,549 | $133,790 | $12,000 | $121,790 |
Source: Public Records
Map
Nearby Homes
- 3920 Carolyn St
- 3908 Carolyn St
- 3934 Grape Ave
- 1120 George W Crawford Dr
- 2362 Belair Spring Rd
- 2355 Belair Spring Rd
- 2083 Willhaven Dr
- 2111 Willhaven Dr
- 3950 Barrett St
- 2082 Willhaven Dr
- 2339 Belair Spring Rd
- 1609 Orange Ave
- 1506 Weaver Dr
- 2305 Belair Spring Rd
- 3194 Waverly Ln
- 3201 Waverly Ln
- 2912 Wellington St
- 2767 Huntcliffe Dr
- 1263 Bent Water Cir
- 2771 Huntcliffe Dr
Your Personal Tour Guide
Ask me questions while you tour the home.