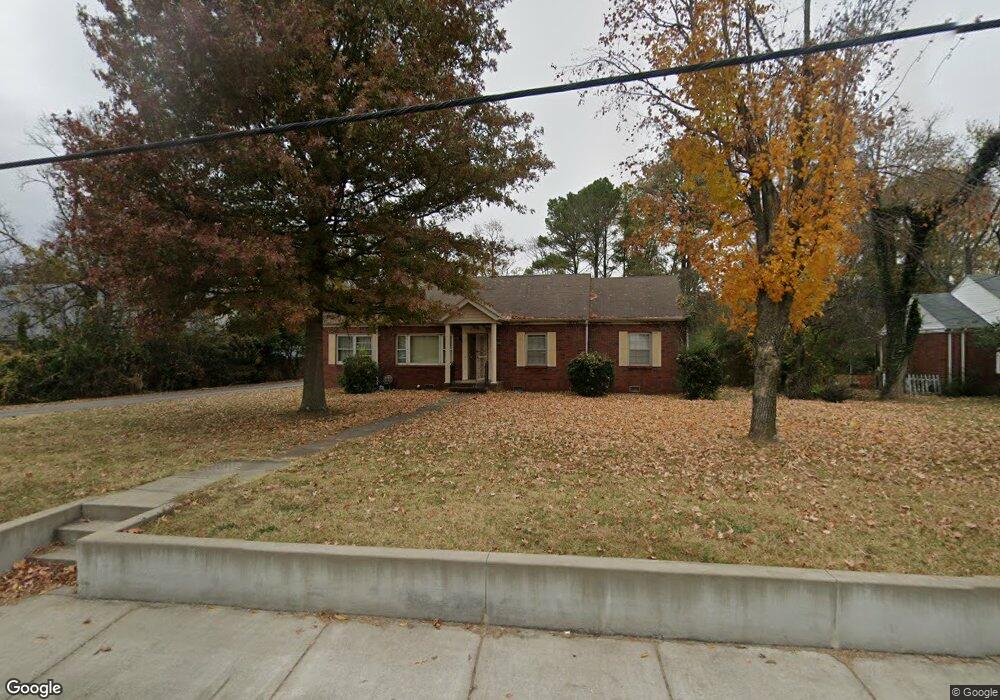
1703 Greenland Dr Murfreesboro, TN 37130
Estimated Value: $327,241 - $418,000
--
Bed
1
Bath
1,529
Sq Ft
$249/Sq Ft
Est. Value
About This Home
This home is located at 1703 Greenland Dr, Murfreesboro, TN 37130 and is currently estimated at $380,060, approximately $248 per square foot. 1703 Greenland Dr is a home located in Rutherford County with nearby schools including Discovery School, Reeves-Rogers Elementary School, and Oakland Middle School.
Ownership History
Date
Name
Owned For
Owner Type
Purchase Details
Closed on
Feb 25, 2010
Sold by
Mayo Mark
Bought by
Blankenship Donald S
Current Estimated Value
Home Financials for this Owner
Home Financials are based on the most recent Mortgage that was taken out on this home.
Original Mortgage
$80,000
Interest Rate
4.97%
Purchase Details
Closed on
Aug 14, 2006
Sold by
Edgington Darren L
Bought by
Mayo and Robin
Home Financials for this Owner
Home Financials are based on the most recent Mortgage that was taken out on this home.
Original Mortgage
$113,000
Interest Rate
6.67%
Purchase Details
Closed on
Aug 31, 2000
Sold by
Alice Harmon D
Bought by
Edgington Darren L and Edgington Julie
Purchase Details
Closed on
May 10, 2000
Sold by
Harmon Lester V
Bought by
Alice Harmon D
Create a Home Valuation Report for This Property
The Home Valuation Report is an in-depth analysis detailing your home's value as well as a comparison with similar homes in the area
Home Values in the Area
Average Home Value in this Area
Purchase History
| Date | Buyer | Sale Price | Title Company |
|---|---|---|---|
| Blankenship Donald S | $120,000 | -- | |
| Mayo | $113,000 | -- | |
| Edgington Darren L | $102,500 | -- | |
| Alice Harmon D | -- | -- |
Source: Public Records
Mortgage History
| Date | Status | Borrower | Loan Amount |
|---|---|---|---|
| Closed | Alice Harmon D | $80,000 | |
| Previous Owner | Alice Harmon D | $113,000 |
Source: Public Records
Tax History Compared to Growth
Tax History
| Year | Tax Paid | Tax Assessment Tax Assessment Total Assessment is a certain percentage of the fair market value that is determined by local assessors to be the total taxable value of land and additions on the property. | Land | Improvement |
|---|---|---|---|---|
| 2025 | $1,824 | $64,475 | $13,750 | $50,725 |
| 2024 | $1,824 | $64,475 | $13,750 | $50,725 |
| 2023 | $1,210 | $64,475 | $13,750 | $50,725 |
| 2022 | $1,656 | $64,475 | $13,750 | $50,725 |
| 2021 | $996 | $44,875 | $10,625 | $34,250 |
| 2020 | $996 | $44,875 | $10,625 | $34,250 |
| 2019 | $996 | $44,875 | $10,625 | $34,250 |
| 2018 | $1,368 | $44,875 | $0 | $0 |
| 2017 | $1,279 | $32,925 | $0 | $0 |
| 2016 | $1,279 | $32,925 | $0 | $0 |
| 2015 | $1,279 | $32,925 | $0 | $0 |
| 2014 | $819 | $32,925 | $0 | $0 |
| 2013 | -- | $29,325 | $0 | $0 |
Source: Public Records
Map
Nearby Homes
- 1245 Old Lascassas Rd Unit C
- 703 Chickasaw Rd
- 1005 Empire Blvd
- 1029 Empire Blvd
- 706 N Rutherford Blvd
- 2210 Keegan Dr
- 2514 Keegan Dr
- 1006 Harrison Ave
- 2175 Veranda Place
- 915 Leaf Ave Unit 917
- 2123 Gold Valley Dr
- 2153 Gold Valley Dr
- 2187 Gold Valley Dr
- 2251 Middle Tennessee Blvd
- 1144 Tradition Trail Unit 52
- 1214 Wenlon Dr
- 1407 Leaf Ave
- 1430 E Main St
- 2315 Gold Valley Dr Unit C1
- 2315 Gold Valley Dr Unit B1
- 1707 Greenland Dr
- 1619 Greenland Dr
- 1711 Greenland Dr
- 1611 Greenland Dr
- 910 Brown Dr
- 1607 Greenland Dr
- 1603 Greenland Dr
- 915 Brown Dr
- 1519 Greenland Dr
- 1515 Greenland Dr
- 914 Old Lascassas Rd
- 1511 Greenland Dr
- 1815 Greenland Dr Unit 1817
- 1006 Old Lascassas Rd
- 1116 Old Lascassas Rd
- 1720 E Main St
- 1014 Old Lascassas Rd
- 1818 Greenland Dr
- 907 Scottland Dr
- 1124 Old Lascassas Rd