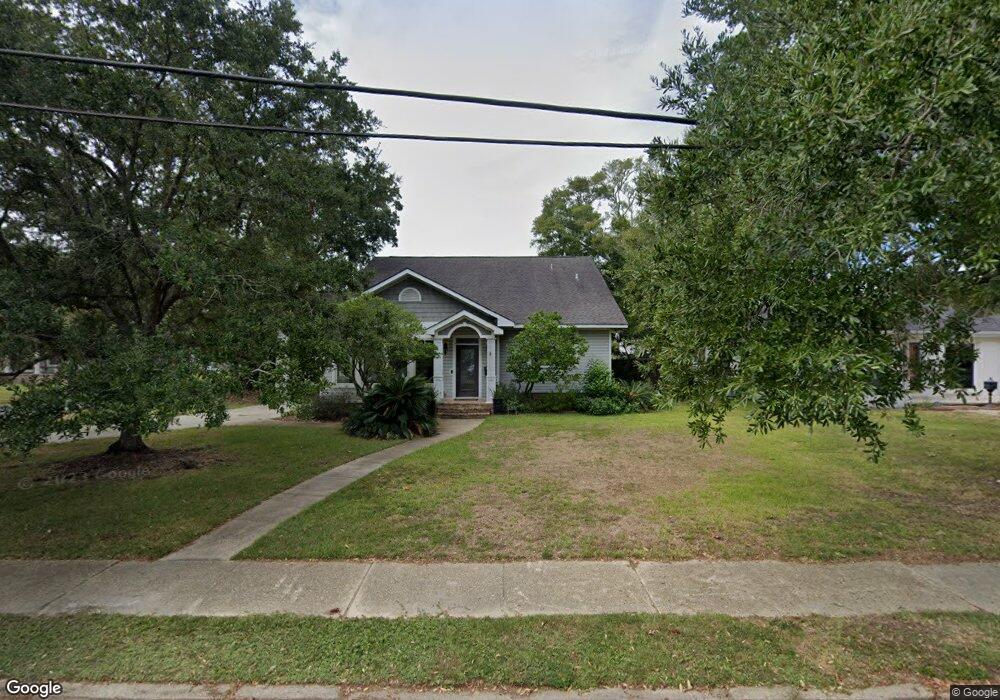
1703 Pascagoula St Pascagoula, MS 39567
Estimated Value: $256,000 - $408,000
--
Bed
--
Bath
3,095
Sq Ft
$97/Sq Ft
Est. Value
About This Home
This home is located at 1703 Pascagoula St, Pascagoula, MS 39567 and is currently estimated at $301,174, approximately $97 per square foot. 1703 Pascagoula St is a home located in Jackson County with nearby schools including Central Elementary School, Trent Lott Academy, and Colmer Middle School.
Ownership History
Date
Name
Owned For
Owner Type
Purchase Details
Closed on
Aug 16, 2022
Sold by
Foots Joseph L
Bought by
Bosarge Leann Nicole
Current Estimated Value
Purchase Details
Closed on
Aug 2, 2017
Bought by
Bosarge Stephanie
Home Financials for this Owner
Home Financials are based on the most recent Mortgage that was taken out on this home.
Original Mortgage
$180,000
Interest Rate
3.92%
Purchase Details
Closed on
Sep 19, 2016
Sold by
Bosarge Oliver Steven and Bosarge Sandra Harnage
Bought by
Foots Joseph L and Bosarge Leann Nicole
Home Financials for this Owner
Home Financials are based on the most recent Mortgage that was taken out on this home.
Original Mortgage
$225,000
Interest Rate
3.43%
Mortgage Type
Credit Line Revolving
Create a Home Valuation Report for This Property
The Home Valuation Report is an in-depth analysis detailing your home's value as well as a comparison with similar homes in the area
Home Values in the Area
Average Home Value in this Area
Purchase History
| Date | Buyer | Sale Price | Title Company |
|---|---|---|---|
| Bosarge Leann Nicole | -- | Bordis And Danos Pllc | |
| Bosarge Stephanie | $207,000 | -- | |
| Foots Joseph L | -- | None Available |
Source: Public Records
Mortgage History
| Date | Status | Borrower | Loan Amount |
|---|---|---|---|
| Previous Owner | Bosarge Stephanie | $180,000 | |
| Previous Owner | Bosarge Stephanie | -- | |
| Previous Owner | Foots Joseph L | $225,000 |
Source: Public Records
Tax History Compared to Growth
Tax History
| Year | Tax Paid | Tax Assessment Tax Assessment Total Assessment is a certain percentage of the fair market value that is determined by local assessors to be the total taxable value of land and additions on the property. | Land | Improvement |
|---|---|---|---|---|
| 2024 | $2,306 | $16,625 | $3,062 | $13,563 |
| 2023 | $2,306 | $16,625 | $3,062 | $13,563 |
| 2022 | $2,282 | $16,625 | $3,062 | $13,563 |
| 2021 | $2,309 | $16,799 | $3,062 | $13,737 |
| 2020 | $2,254 | $16,265 | $3,224 | $13,041 |
| 2019 | $2,275 | $16,265 | $3,224 | $13,041 |
| 2018 | $2,307 | $16,265 | $3,224 | $13,041 |
| 2017 | $1,966 | $16,265 | $3,224 | $13,041 |
| 2016 | $3,399 | $24,398 | $4,836 | $19,562 |
| 2015 | $1,908 | $158,540 | $32,240 | $126,300 |
| 2014 | $1,924 | $15,854 | $3,224 | $12,630 |
| 2013 | $1,863 | $15,750 | $3,224 | $12,526 |
Source: Public Records
Map
Nearby Homes
- 1703 Resca de La Palma St
- 1607 Resca de La Palma St
- 1907 Resca de La Palma St
- 1815 Cherubusco St
- 1810 Roosevelt St
- 1603 Roosevelt St
- 1915 Roosevelt St
- 1106 Resca de La Palma St
- 1009 Resca de La Palma St
- 1812 Market St
- 605 Ford Ave
- 1709 Smith Ave
- 1411 Mantou St
- 1406 Polk Ave
- 1219 Polk Ave
- 0 E St
- 1407 Mantou St
- 1003 Mantou St
- 809 Herrick Ave
- 865 Market St
- 1703 Pascagoula St
- 1729 Pascagoula St
- 1607 Pascagoula St
- 1719 Pascagoula St
- 1707 Pascagoula St
- 1619 Pascagoula St
- 1006 Lafayette Ave
- 1809 Pascagoula St
- 1817 Pascagoula St
- 1610 Pascagoula St
- 1608 Pascagoula St
- 1002 Lafayette Ave
- 1758 Pascagoula St
- 1615 Pascagoula St
- 1007 Columbus Dr
- 1802 Pascagoula St
- 1602 Pascagoula St
- 1810 Pascagoula St
- 1510 Pascagoula St
- 1003 Columbus Dr