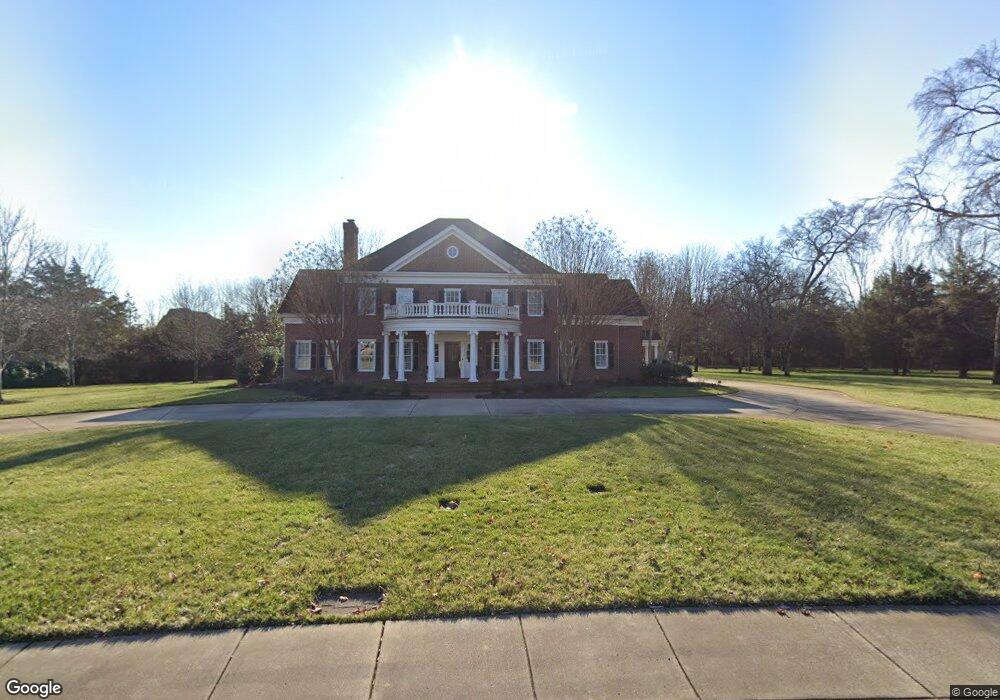
1703 Shagbark Trail Murfreesboro, TN 37130
Estimated Value: $1,170,000 - $1,700,000
--
Bed
6
Baths
6,601
Sq Ft
$232/Sq Ft
Est. Value
About This Home
This home is located at 1703 Shagbark Trail, Murfreesboro, TN 37130 and is currently estimated at $1,531,464, approximately $232 per square foot. 1703 Shagbark Trail is a home located in Rutherford County with nearby schools including John Pittard Elementary School, Oakland Middle School, and Oakland High School.
Ownership History
Date
Name
Owned For
Owner Type
Purchase Details
Closed on
Mar 7, 2024
Sold by
Knox Julie H
Bought by
Parsley Benjamin Louis and Parsley Margaret W
Current Estimated Value
Home Financials for this Owner
Home Financials are based on the most recent Mortgage that was taken out on this home.
Original Mortgage
$183,450
Outstanding Balance
$176,548
Interest Rate
6.69%
Mortgage Type
Credit Line Revolving
Estimated Equity
$1,354,916
Purchase Details
Closed on
Nov 12, 1999
Sold by
Holland Jimmu H
Bought by
Knox Julie H
Purchase Details
Closed on
Oct 21, 1997
Sold by
Northwoods Est Llc
Bought by
Holland Jimmy H and Holland Laura
Home Financials for this Owner
Home Financials are based on the most recent Mortgage that was taken out on this home.
Original Mortgage
$86,250
Interest Rate
7.39%
Mortgage Type
Purchase Money Mortgage
Create a Home Valuation Report for This Property
The Home Valuation Report is an in-depth analysis detailing your home's value as well as a comparison with similar homes in the area
Home Values in the Area
Average Home Value in this Area
Purchase History
| Date | Buyer | Sale Price | Title Company |
|---|---|---|---|
| Parsley Benjamin Louis | $1,634,000 | Paramount Murfreesboro Title | |
| Knox Julie H | $100,000 | -- | |
| Holland Jimmy H | $115,000 | -- |
Source: Public Records
Mortgage History
| Date | Status | Borrower | Loan Amount |
|---|---|---|---|
| Open | Parsley Benjamin Louis | $183,450 | |
| Previous Owner | Holland Jimmy H | $86,250 |
Source: Public Records
Tax History Compared to Growth
Tax History
| Year | Tax Paid | Tax Assessment Tax Assessment Total Assessment is a certain percentage of the fair market value that is determined by local assessors to be the total taxable value of land and additions on the property. | Land | Improvement |
|---|---|---|---|---|
| 2025 | $9,096 | $321,550 | $47,250 | $274,300 |
| 2024 | $9,096 | $321,550 | $47,250 | $274,300 |
| 2023 | $5,982 | $318,825 | $47,250 | $271,575 |
| 2022 | $5,098 | $315,450 | $47,250 | $268,200 |
| 2021 | $4,752 | $214,125 | $47,250 | $166,875 |
| 2020 | $4,752 | $214,125 | $47,250 | $166,875 |
| 2019 | $4,752 | $214,125 | $47,250 | $166,875 |
| 2018 | $6,528 | $214,125 | $0 | $0 |
| 2017 | $7,672 | $197,375 | $0 | $0 |
| 2016 | $7,672 | $197,375 | $0 | $0 |
| 2015 | $7,672 | $197,375 | $0 | $0 |
| 2014 | $4,908 | $197,375 | $0 | $0 |
| 2013 | -- | $195,500 | $0 | $0 |
Source: Public Records
Map
Nearby Homes
- 1430 Avellino Cir
- 1512 Mirabella Way
- 1728 Shagbark Trail
- 1409 E Northfield Blvd
- 1325 E Northfield Blvd
- 3014 Winterberry Dr
- 3017 Winterberry Dr
- 1445 Bradberry Dr
- 1906 Mosaic Trail
- 2111 Lovelace Ln
- 1504 Winterberry Dr
- 2164 White Poplar Ct
- 2243 Northwoods Dr
- 2342 N Tennessee Blvd Unit 1403
- 2342 N Tennessee Blvd Unit 1503
- 2342 N Tennessee Blvd Unit 705
- 2342 N Tennessee Blvd Unit 1203
- 2342 N Tennessee Blvd Unit 104
- 1207 Mullberry Ct
- 2223 Brick Way
- 1455 Avellino Cir
- 1702 Shagbark Trail
- 1709 Shagbark Trail
- 1451 Avellino Cir
- 1610 Shagbark Trail
- 1459 Avellino Cir
- 1607 Shagbark Trail
- 2037 Eastridge Dr
- 1708 Shagbark Trail
- 1606 Shagbark Trail
- 1715 Shagbark Trail
- 2033 Eastridge Dr
- 1447 Avellino Cir
- 2103 Eastridge Dr
- 1450 Avellino Cir
- 1603 Shagbark Trail
- 2029 Eastridge Dr
- 1463 Avellino Cir
- 1434 Northwoods Cove