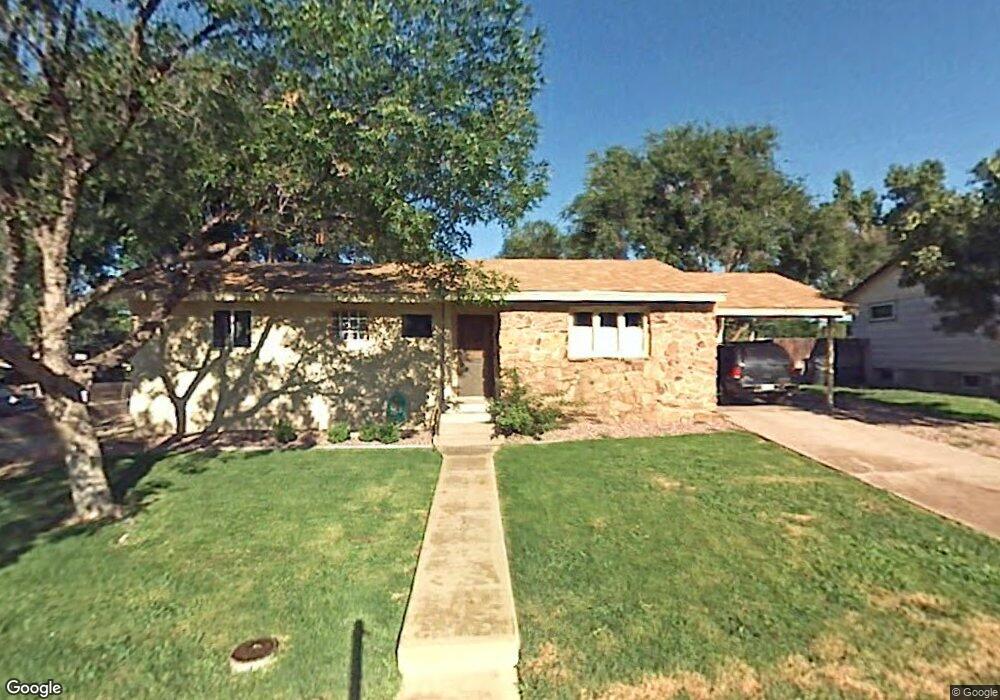
1703 Sheridan Rd Pueblo, CO 81001
Belmont NeighborhoodEstimated Value: $225,908 - $252,000
3
Beds
2
Baths
1,090
Sq Ft
$224/Sq Ft
Est. Value
About This Home
This home is located at 1703 Sheridan Rd, Pueblo, CO 81001 and is currently estimated at $244,227, approximately $224 per square foot. 1703 Sheridan Rd is a home located in Pueblo County with nearby schools including Belmont Elementary School, Heaton Middle School, and East High School.
Ownership History
Date
Name
Owned For
Owner Type
Purchase Details
Closed on
Sep 15, 2025
Sold by
Cortese Wendy E and Romero Wendy E
Bought by
Romero Wendy E
Current Estimated Value
Purchase Details
Closed on
Jun 26, 2017
Sold by
Cortese Samuel J and Cortese Wendy
Bought by
Cortese Wendy E
Home Financials for this Owner
Home Financials are based on the most recent Mortgage that was taken out on this home.
Original Mortgage
$108,500
Interest Rate
3.89%
Mortgage Type
New Conventional
Purchase Details
Closed on
Dec 2, 2016
Sold by
Cortese Samuel J
Bought by
Cortese Samuel J and Cortese Wendy
Purchase Details
Closed on
Dec 17, 2003
Sold by
Mclin Robert J + Judith A
Bought by
Cortese Samuel J
Purchase Details
Closed on
May 3, 1984
Sold by
Martin Kenda K
Bought by
Mclin Robert J + Judith A
Purchase Details
Closed on
Sep 3, 1981
Sold by
Palmer Deborah K
Bought by
Martin Kenda K
Purchase Details
Closed on
Jun 21, 1979
Sold by
Sandoval Abe A + Judy
Bought by
Palmer Deborah K
Create a Home Valuation Report for This Property
The Home Valuation Report is an in-depth analysis detailing your home's value as well as a comparison with similar homes in the area
Home Values in the Area
Average Home Value in this Area
Purchase History
| Date | Buyer | Sale Price | Title Company |
|---|---|---|---|
| Romero Wendy E | -- | None Listed On Document | |
| Cortese Wendy E | -- | Land Title Guarantee Company | |
| Cortese Samuel J | -- | None Available | |
| Cortese Samuel J | $93,900 | -- | |
| Mclin Robert J + Judith A | $40,000 | -- | |
| Martin Kenda K | $45,700 | -- | |
| Palmer Deborah K | $39,500 | -- |
Source: Public Records
Mortgage History
| Date | Status | Borrower | Loan Amount |
|---|---|---|---|
| Previous Owner | Cortese Wendy E | $108,500 |
Source: Public Records
Tax History Compared to Growth
Tax History
| Year | Tax Paid | Tax Assessment Tax Assessment Total Assessment is a certain percentage of the fair market value that is determined by local assessors to be the total taxable value of land and additions on the property. | Land | Improvement |
|---|---|---|---|---|
| 2024 | $868 | $8,820 | -- | -- |
| 2023 | $878 | $12,510 | $1,340 | $11,170 |
| 2022 | $955 | $9,620 | $1,390 | $8,230 |
| 2021 | $986 | $9,900 | $1,430 | $8,470 |
| 2020 | $818 | $9,900 | $1,430 | $8,470 |
| 2019 | $818 | $8,097 | $751 | $7,346 |
| 2018 | $599 | $6,606 | $756 | $5,850 |
| 2017 | $605 | $6,606 | $756 | $5,850 |
| 2016 | $582 | $6,401 | $836 | $5,565 |
| 2015 | $579 | $6,401 | $836 | $5,565 |
| 2014 | $565 | $6,230 | $836 | $5,394 |
Source: Public Records
Map
Nearby Homes
- 1814 Lark Bunting Ln
- 1706 Comanche Rd
- 11 Macnaughton Rd
- 1701 Jerry Murphy Rd
- 36 Scotland Rd
- 1426 Bonforte Blvd
- 18 Dundee Ln
- 1712 Alexander Cir
- 5 Douglas Ln
- 1120 Horseshoe Dr
- 2 Alan Shepard Rd Unit 8
- 1201 Alexander Cir
- 2 Hilton Ln
- 62 Louis Nelson Rd
- 1827 Seminole Ln
- 1518 Horseshoe Dr
- 39 Apollo Ln
- 130 Scotland Rd Unit D
- 1521 Lexington Rd
- 1534 Saratoga Rd
- 1705 Sheridan Rd
- 1701 Sheridan Rd
- 1704 Zuni Rd
- 1702 Zuni Rd
- 1706 Zuni Rd
- 1707 Sheridan Rd
- 1704 Sheridan Rd
- 1702 Sheridan Rd
- 1706 Sheridan Rd
- 1709 Sheridan Rd
- 1710 Zuni Rd
- 1624 Zuni Rd
- 1639 Horseshoe Place
- 1708 Sheridan Rd
- 1802 Lark Bunting Ln
- 1703 Bonny Brae Ln
- 1638 Horseshoe Place
- 1703 Zuni Rd
- 1701 Zuni Rd
- 1701 Bonny Brae Ln