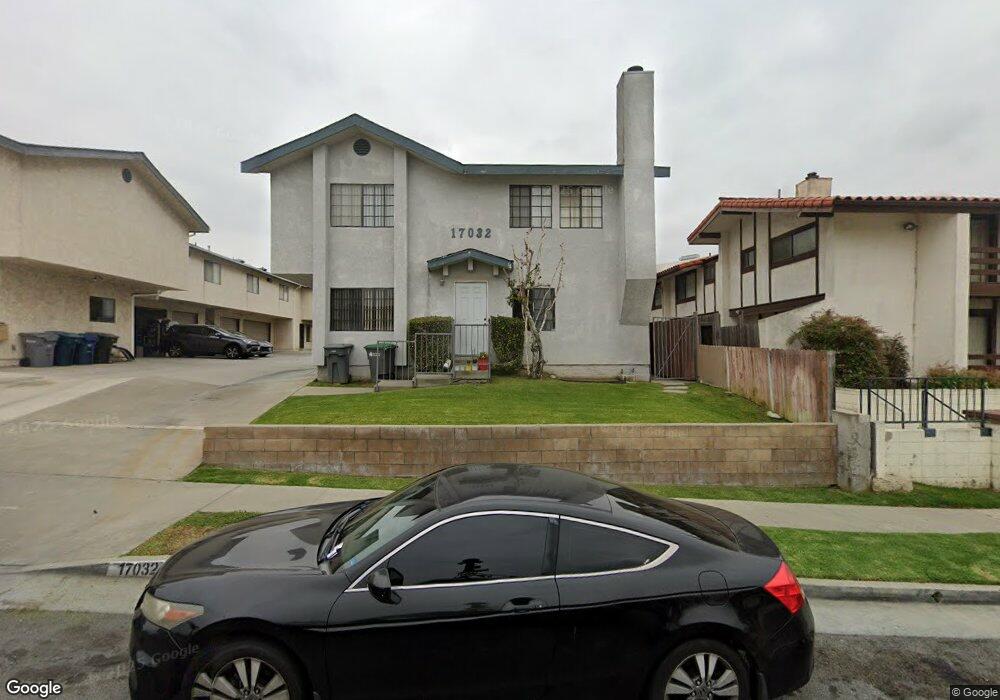
17032 S New Hampshire Ave Gardena, CA 90247
Estimated Value: $1,474,000 - $1,768,000
6
Beds
6
Baths
4,085
Sq Ft
$397/Sq Ft
Est. Value
About This Home
This home is located at 17032 S New Hampshire Ave, Gardena, CA 90247 and is currently estimated at $1,621,109, approximately $396 per square foot. 17032 S New Hampshire Ave is a home located in Los Angeles County with nearby schools including Gardena Elementary School, Robert E. Peary Middle School, and Gardena Senior High School.
Ownership History
Date
Name
Owned For
Owner Type
Purchase Details
Closed on
Feb 5, 2020
Sold by
Wang Jia Peir and Wang Yueh Chin Hsu
Bought by
Aj D2 Wang Lp
Current Estimated Value
Purchase Details
Closed on
Jun 19, 2002
Sold by
Ko Carol and Huang Hsueh Yun
Bought by
Wang Jia Peir
Home Financials for this Owner
Home Financials are based on the most recent Mortgage that was taken out on this home.
Original Mortgage
$350,000
Outstanding Balance
$145,397
Interest Rate
6.7%
Estimated Equity
$1,475,712
Purchase Details
Closed on
Aug 4, 1997
Sold by
Formosam Dev Nhv 163 Project
Bought by
Ko Carol
Home Financials for this Owner
Home Financials are based on the most recent Mortgage that was taken out on this home.
Original Mortgage
$220,150
Interest Rate
6.5%
Create a Home Valuation Report for This Property
The Home Valuation Report is an in-depth analysis detailing your home's value as well as a comparison with similar homes in the area
Home Values in the Area
Average Home Value in this Area
Purchase History
| Date | Buyer | Sale Price | Title Company |
|---|---|---|---|
| Aj D2 Wang Lp | -- | None Listed On Document | |
| Wang Irrevocable Trust | -- | None Listed On Document | |
| Wang Family Trust | -- | None Listed On Document | |
| Aj D2 Wang Lp | -- | None Available | |
| Wang Jia Peir | $500,000 | Commonwealth Land Title | |
| Ko Carol | $315,000 | Chicago Title Co |
Source: Public Records
Mortgage History
| Date | Status | Borrower | Loan Amount |
|---|---|---|---|
| Previous Owner | Wang Jia Peir | $350,000 | |
| Previous Owner | Ko Carol | $220,150 |
Source: Public Records
Tax History Compared to Growth
Tax History
| Year | Tax Paid | Tax Assessment Tax Assessment Total Assessment is a certain percentage of the fair market value that is determined by local assessors to be the total taxable value of land and additions on the property. | Land | Improvement |
|---|---|---|---|---|
| 2025 | $9,430 | $724,147 | $265,033 | $459,114 |
| 2024 | $9,430 | $709,949 | $259,837 | $450,112 |
| 2023 | $9,265 | $696,030 | $254,743 | $441,287 |
| 2022 | $8,820 | $1,340,280 | $775,200 | $565,080 |
| 2021 | $8,721 | $669,004 | $244,852 | $424,152 |
| 2020 | $8,786 | $662,145 | $242,342 | $419,803 |
| 2019 | $8,445 | $649,163 | $237,591 | $411,572 |
| 2018 | $8,271 | $636,435 | $232,933 | $403,502 |
| 2016 | $7,880 | $611,724 | $223,889 | $387,835 |
| 2015 | $7,750 | $602,536 | $220,526 | $382,010 |
| 2014 | $7,758 | $590,734 | $216,207 | $374,527 |
Source: Public Records
Map
Nearby Homes
- 17002 S Catalina Ave
- 17035 S Catalina Ave
- 16828 S Budlong Ave
- 710 W 172nd St
- 1213 W 168th St Unit C
- 1040 W 165th Place
- 16911 S Raymond Place
- 762 W Gardena Blvd
- 527 W 169th St
- 16701 S Denver Ave
- 16619 S Denver Ave
- 1308 W 163rd St Unit 1
- 18114 S Budlong Ave
- 16938 S Dalton Ave
- 16001 S Vermont Ave Unit 60
- 1419 W 179th St Unit 22
- 1419 W 179th St Unit 3
- 17039 S Dalton Ave
- 16720 S Dalton Ave
- 1119 Electric St
- 17028 S New Hampshire Ave Unit 3
- 17028 S New Hampshire Ave
- 17022 S New Hampshire Ave
- 17009 S New Hampshire Ave
- 17027 S Vermont Ave Unit 2
- 17087 S Vermont Ave Unit 129B
- 17087 S Vermont Ave Unit 128B
- 17087 S Vermont Ave Unit 127B
- 17087 S Vermont Ave Unit 126B
- 17087 S Vermont Ave Unit 125
- 17087 S Vermont Ave Unit 124
- 17087 S Vermont Ave Unit 123
- 17087 S Vermont Ave Unit 122
- 17087 S Vermont Ave Unit 121
- 17018 S New Hampshire Ave Unit 1
- 17018 S New Hampshire Ave Unit A
- 17018 S New Hampshire Ave Unit B
- 17018 S New Hampshire Ave
- 17037 S Vermont Ave
- 17057 S Vermont Ave