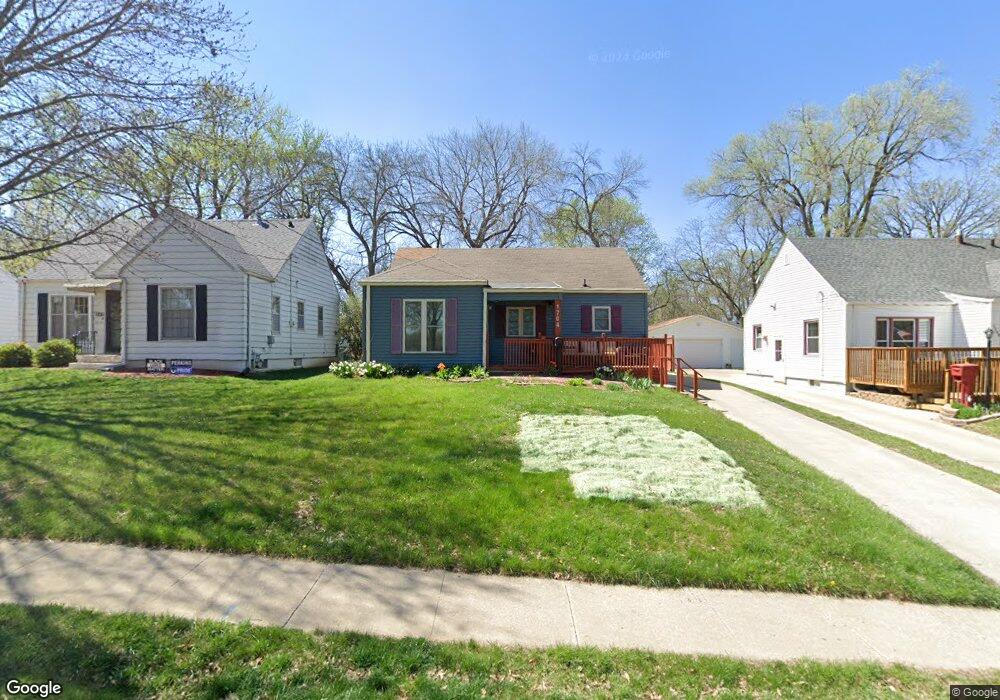
1704 44th St Des Moines, IA 50310
Waveland Park NeighborhoodEstimated Value: $237,000 - $258,000
2
Beds
1
Bath
859
Sq Ft
$290/Sq Ft
Est. Value
About This Home
This home is located at 1704 44th St, Des Moines, IA 50310 and is currently estimated at $249,110, approximately $290 per square foot. 1704 44th St is a home located in Polk County with nearby schools including Perkins Elementary School, Merrill Middle School, and Roosevelt High School.
Ownership History
Date
Name
Owned For
Owner Type
Purchase Details
Closed on
Apr 15, 2009
Sold by
Clark Jeanine K
Bought by
Havlicek Camy J and Havlicek Gina E
Current Estimated Value
Home Financials for this Owner
Home Financials are based on the most recent Mortgage that was taken out on this home.
Original Mortgage
$127,153
Outstanding Balance
$81,454
Interest Rate
5.19%
Mortgage Type
FHA
Estimated Equity
$167,656
Purchase Details
Closed on
Jan 16, 2009
Sold by
Redeker John Ray
Bought by
Clark Jeanine K
Purchase Details
Closed on
May 12, 2004
Sold by
Cole Wayne Lee and Carson Joyce Ann
Bought by
Redeker John Ray and Clark Jeanine K
Home Financials for this Owner
Home Financials are based on the most recent Mortgage that was taken out on this home.
Original Mortgage
$116,078
Interest Rate
5.63%
Mortgage Type
FHA
Create a Home Valuation Report for This Property
The Home Valuation Report is an in-depth analysis detailing your home's value as well as a comparison with similar homes in the area
Home Values in the Area
Average Home Value in this Area
Purchase History
| Date | Buyer | Sale Price | Title Company |
|---|---|---|---|
| Havlicek Camy J | $129,000 | None Available | |
| Clark Jeanine K | -- | None Available | |
| Redeker John Ray | $117,500 | -- |
Source: Public Records
Mortgage History
| Date | Status | Borrower | Loan Amount |
|---|---|---|---|
| Open | Havlicek Camy J | $127,153 | |
| Previous Owner | Redeker John Ray | $116,078 |
Source: Public Records
Tax History Compared to Growth
Tax History
| Year | Tax Paid | Tax Assessment Tax Assessment Total Assessment is a certain percentage of the fair market value that is determined by local assessors to be the total taxable value of land and additions on the property. | Land | Improvement |
|---|---|---|---|---|
| 2025 | $3,810 | $252,500 | $49,100 | $203,400 |
| 2024 | $3,810 | $227,100 | $43,500 | $183,600 |
| 2023 | $3,792 | $227,100 | $43,500 | $183,600 |
| 2022 | $3,762 | $192,800 | $38,500 | $154,300 |
| 2021 | $3,630 | $192,800 | $38,500 | $154,300 |
| 2020 | $3,766 | $177,100 | $35,100 | $142,000 |
| 2019 | $3,384 | $177,100 | $35,100 | $142,000 |
| 2018 | $3,344 | $157,400 | $30,700 | $126,700 |
| 2017 | $3,044 | $157,400 | $30,700 | $126,700 |
| 2016 | $2,962 | $144,100 | $27,500 | $116,600 |
| 2015 | $2,962 | $144,100 | $27,500 | $116,600 |
| 2014 | $2,842 | $138,700 | $26,100 | $112,600 |
Source: Public Records
Map
Nearby Homes