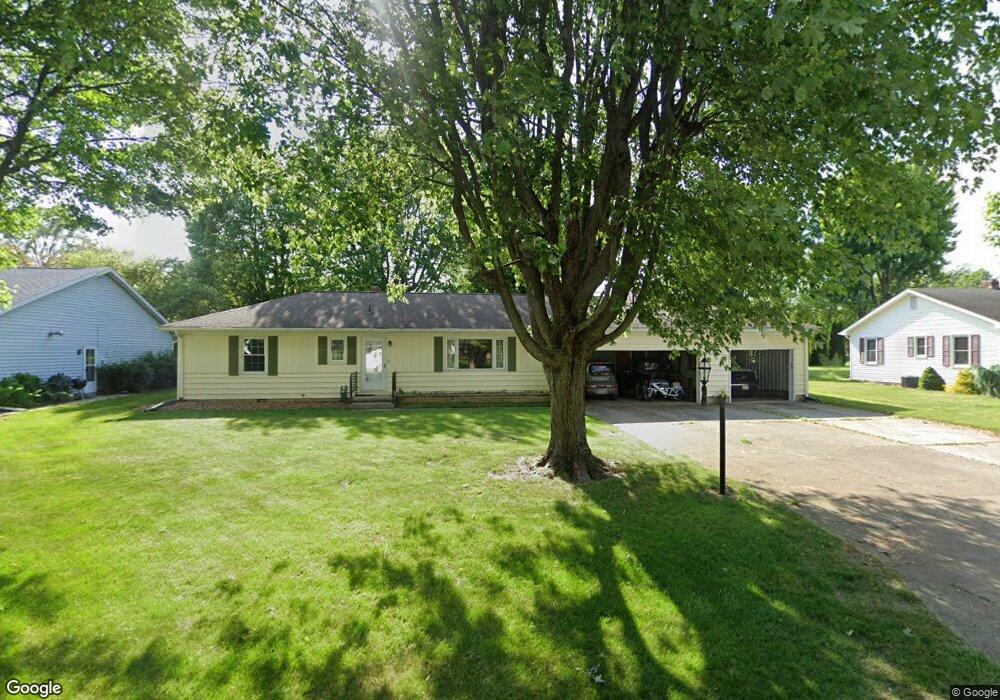
1704 Arrowhead Dr Fremont, OH 43420
Estimated Value: $204,000 - $251,000
3
Beds
1
Bath
1,436
Sq Ft
$156/Sq Ft
Est. Value
About This Home
This home is located at 1704 Arrowhead Dr, Fremont, OH 43420 and is currently estimated at $224,184, approximately $156 per square foot. 1704 Arrowhead Dr is a home located in Sandusky County with nearby schools including Fremont Ross High School, Bishop Hoffman Catholic School - This is St Joe's School now, and St. Joseph School.
Ownership History
Date
Name
Owned For
Owner Type
Purchase Details
Closed on
Apr 7, 2018
Sold by
Hollis Noble C and Hollis Cathleen D
Bought by
Hollis Noble C and Hollis Cathleen
Current Estimated Value
Purchase Details
Closed on
Jul 28, 2017
Sold by
Frisch Paul D and Frisch Residence Trust
Bought by
Hollis Noble C and Hollis Cathleen
Home Financials for this Owner
Home Financials are based on the most recent Mortgage that was taken out on this home.
Original Mortgage
$91,040
Outstanding Balance
$75,801
Interest Rate
3.88%
Mortgage Type
New Conventional
Estimated Equity
$148,383
Purchase Details
Closed on
Nov 8, 2016
Sold by
Frisch Paul Dennis and Paul J Frisch Family Living Tr
Bought by
Frisch Paul D and Frisch Residence Trust
Purchase Details
Closed on
Jul 18, 2016
Sold by
Frisch Frances A Trustee
Bought by
Frisch Paul Dennis Trustee
Home Financials for this Owner
Home Financials are based on the most recent Mortgage that was taken out on this home.
Interest Rate
3.42%
Create a Home Valuation Report for This Property
The Home Valuation Report is an in-depth analysis detailing your home's value as well as a comparison with similar homes in the area
Home Values in the Area
Average Home Value in this Area
Purchase History
| Date | Buyer | Sale Price | Title Company |
|---|---|---|---|
| Hollis Noble C | -- | None Available | |
| Hollis Noble C | $113,800 | Peak Title Agency | |
| Frisch Paul D | -- | None Available | |
| Frisch Paul Dennis Trustee | -- | -- |
Source: Public Records
Mortgage History
| Date | Status | Borrower | Loan Amount |
|---|---|---|---|
| Open | Hollis Noble C | $91,040 | |
| Previous Owner | Frisch Paul Dennis Trustee | -- |
Source: Public Records
Tax History Compared to Growth
Tax History
| Year | Tax Paid | Tax Assessment Tax Assessment Total Assessment is a certain percentage of the fair market value that is determined by local assessors to be the total taxable value of land and additions on the property. | Land | Improvement |
|---|---|---|---|---|
| 2024 | $2,609 | $65,530 | $12,710 | $52,820 |
| 2023 | $2,609 | $49,150 | $9,630 | $39,520 |
| 2022 | $2,090 | $49,150 | $9,630 | $39,520 |
| 2021 | $2,152 | $49,150 | $9,630 | $39,520 |
| 2020 | $1,735 | $38,820 | $9,630 | $29,190 |
| 2019 | $1,694 | $38,820 | $9,630 | $29,190 |
| 2018 | $1,648 | $38,820 | $9,630 | $29,190 |
| 2017 | $1,525 | $34,900 | $9,630 | $25,270 |
| 2016 | $979 | $34,900 | $9,630 | $25,270 |
| 2015 | $964 | $34,900 | $9,630 | $25,270 |
| 2014 | $1,099 | $37,350 | $9,520 | $27,830 |
| 2013 | $1,076 | $37,350 | $9,520 | $27,830 |
Source: Public Records
Map
Nearby Homes
- 10 Meadowbrook Dr
- 10 Meadowbrook Ln
- 1420 Center St
- 64 River Run Dr Unit J
- 350 Conner Dr
- 135 Briarwood Cir
- 1818 Finley Dr
- 1970 Morrison Rd
- 1832 Myrtle St
- 1485 Autumn Woods Dr
- 1719 Buckland Ave
- 2484 Buckland Ave
- 1013 Whittlesey St
- 905 Twinn St
- 933 E Cole Rd
- 1028 June St
- 18 Katlyn Dr
- 625 Bush Place
- 815 South St
- 616 S Wood St
- 1710 Arrowhead Dr
- 1700 Arrowhead Dr
- 1715 Tomahawk Trace
- 1731 Tomahawk Trace
- 1470 Chieftain Cir
- 1718 Arrowhead Dr
- 1703 Tomahawk Trace
- 1644 Arrowhead Dr
- 1745 Tomahawk Trace
- 1701 Arrowhead Dr
- 1687 Tomahawk Trace
- 1732 Arrowhead Dr
- 1462 Chieftain Cir
- 0 Tomahawk Trace
- 1727 Arrowhead Dr
- 1645 Arrowhead Dr
- 1749 Tomahawk Trace
- 1714 Tomahawk Trace
- 1448 Chieftain Cir
- 1637 Arrowhead Dr