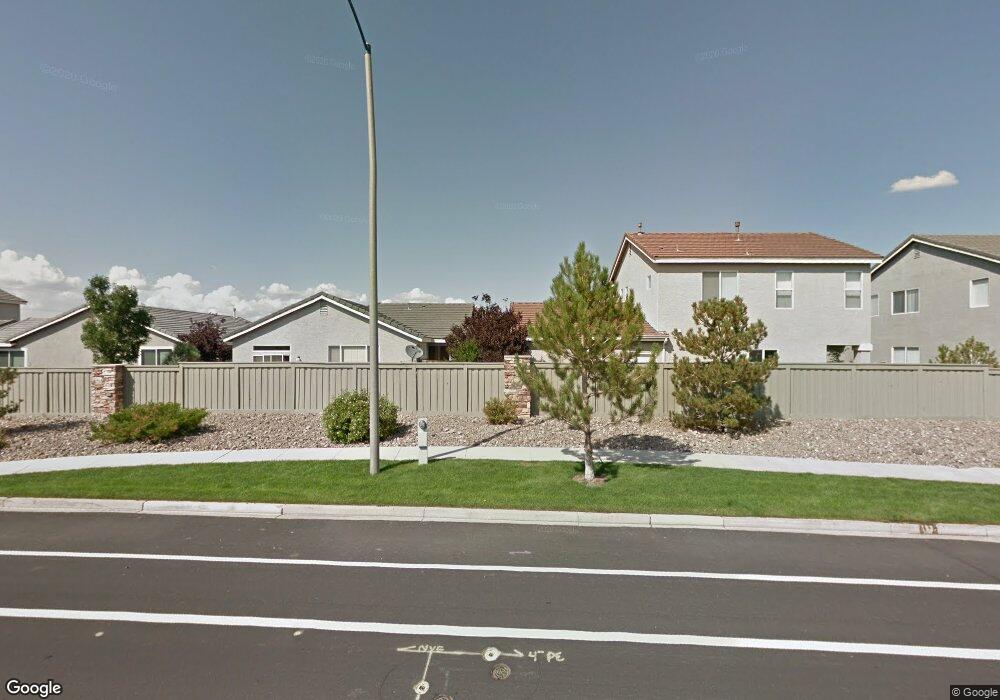
1704 Burwood Cir Reno, NV 89521
Double Diamond NeighborhoodEstimated Value: $515,000 - $549,000
2
Beds
2
Baths
1,470
Sq Ft
$359/Sq Ft
Est. Value
About This Home
This home is located at 1704 Burwood Cir, Reno, NV 89521 and is currently estimated at $527,726, approximately $358 per square foot. 1704 Burwood Cir is a home located in Washoe County with nearby schools including Double Diamond Elementary School, Kendyl Depoali Middle School, and Damonte Ranch High School.
Ownership History
Date
Name
Owned For
Owner Type
Purchase Details
Closed on
Nov 18, 2010
Sold by
Ormsby Lenard and Ormsby Christine A
Bought by
Ormsby Lenard T and Ormsby Christine A
Current Estimated Value
Purchase Details
Closed on
Sep 13, 2007
Sold by
Mckeand Brian and Mckeand Linda D
Bought by
Ormsby Lenard and Ormsby Christine A
Home Financials for this Owner
Home Financials are based on the most recent Mortgage that was taken out on this home.
Original Mortgage
$236,000
Outstanding Balance
$150,183
Interest Rate
6.67%
Mortgage Type
Purchase Money Mortgage
Estimated Equity
$377,543
Purchase Details
Closed on
Mar 24, 2003
Sold by
Wyndgate Village Investors Llc
Bought by
Mckeand Brian and Mckeand Linda D
Home Financials for this Owner
Home Financials are based on the most recent Mortgage that was taken out on this home.
Original Mortgage
$157,700
Interest Rate
5.82%
Create a Home Valuation Report for This Property
The Home Valuation Report is an in-depth analysis detailing your home's value as well as a comparison with similar homes in the area
Home Values in the Area
Average Home Value in this Area
Purchase History
| Date | Buyer | Sale Price | Title Company |
|---|---|---|---|
| Ormsby Lenard T | -- | None Available | |
| Ormsby Lenard | $295,000 | Ticor Title Of Nevada Inc | |
| Mckeand Brian | $197,166 | Inter County Title Co |
Source: Public Records
Mortgage History
| Date | Status | Borrower | Loan Amount |
|---|---|---|---|
| Open | Ormsby Lenard | $236,000 | |
| Previous Owner | Mckeand Brian | $157,700 | |
| Closed | Mckeand Brian | $39,450 |
Source: Public Records
Tax History Compared to Growth
Tax History
| Year | Tax Paid | Tax Assessment Tax Assessment Total Assessment is a certain percentage of the fair market value that is determined by local assessors to be the total taxable value of land and additions on the property. | Land | Improvement |
|---|---|---|---|---|
| 2025 | $2,697 | $99,867 | $32,571 | $67,296 |
| 2024 | $2,697 | $96,617 | $28,823 | $67,795 |
| 2023 | $2,619 | $94,393 | $30,240 | $64,153 |
| 2022 | $2,426 | $78,002 | $24,476 | $53,527 |
| 2021 | $2,357 | $73,896 | $20,759 | $53,137 |
| 2020 | $2,286 | $73,984 | $20,759 | $53,225 |
| 2019 | $2,219 | $71,034 | $20,192 | $50,842 |
| 2018 | $2,151 | $64,765 | $15,057 | $49,708 |
| 2017 | $2,092 | $62,281 | $12,506 | $49,775 |
| 2016 | $2,039 | $62,877 | $12,159 | $50,718 |
| 2015 | $2,035 | $61,498 | $11,025 | $50,473 |
| 2014 | $1,973 | $58,982 | $10,269 | $48,713 |
| 2013 | -- | $51,909 | $7,466 | $44,443 |
Source: Public Records
Map
Nearby Homes
- 1681 Emerald Bay Dr
- 1651 Emerald Bay Dr
- 1781 Emerald Bay Dr
- 1640 Rocky Cove Ln
- 10492 Gold Trail Dr
- 1390 S Fox Glen Ct
- 10400 Rockport Ln
- 10583 Crystal Bay Dr
- 10560 Vista Alta Dr
- 1612 Mountain Ln
- 10316 Sterling View Ct
- 10235 Robilee Dr
- 10145 Donner Peak Dr
- 10050 Goler Wash Ct
- 1485 Wild Wolf Way
- 1680 Cattlemen Ct
- 10375 Rosemount Dr
- 1720 Colavita Way
- 10320 Rosemount Dr
- 9756 Ripple Way
- 1702 Burwood Cir
- 1708 Burwood Cir
- 1710 Burwood Cir
- 10486 Chadwell Dr
- 1700 Burwood Cir
- 10484 Chadwell Dr
- 10482 Chadwell Dr
- 1712 Burwood Cir
- 1716 Burwood Cir
- 1718 Burwood Cir
- 10488 Chadwell Dr
- 1714 Burwood Cir
- 10490 Chadwell Dr
- 10584 Iron Point Cir
- 1705 Burwood Cir
- 10465 Chadwell Dr
- 10496 Chadwell Dr
- 10498 Chadwell Dr
- 10463 Chadwell Dr
- 1715 Burwood Cir