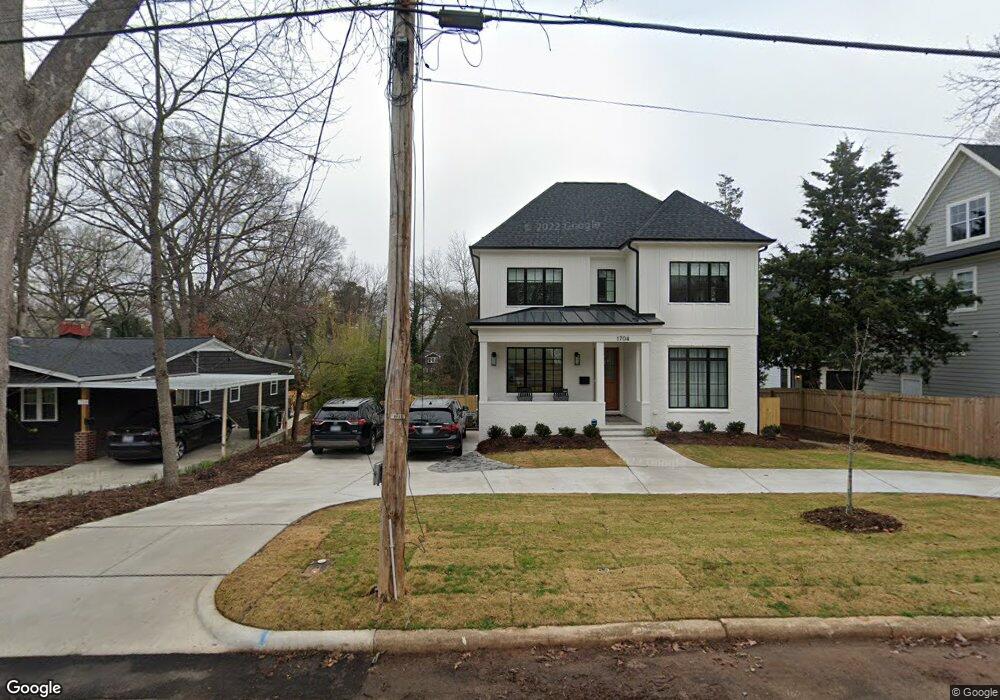
1704 Carson St Raleigh, NC 27608
Hi-mount NeighborhoodEstimated Value: $390,000
--
Bed
2
Baths
1,250
Sq Ft
$312/Sq Ft
Est. Value
About This Home
This home is located at 1704 Carson St, Raleigh, NC 27608 and is currently priced at $390,000, approximately $312 per square foot. 1704 Carson St is a home located in Wake County with nearby schools including Underwood Magnet Elementary School, Oberlin Middle School, and Broughton Magnet High School.
Ownership History
Date
Name
Owned For
Owner Type
Purchase Details
Closed on
Nov 3, 2021
Sold by
Worth Marshall B and Worth Valerie B
Bought by
Wehbie Mary Pb and Wehbie Robert S
Current Estimated Value
Purchase Details
Closed on
Mar 25, 2021
Sold by
Thompson Smith Ventures Llc
Bought by
Worth Marshall B and Worth Valerie B
Home Financials for this Owner
Home Financials are based on the most recent Mortgage that was taken out on this home.
Original Mortgage
$897,192
Interest Rate
2.99%
Mortgage Type
Construction
Purchase Details
Closed on
Jun 16, 2020
Sold by
Cloudbreak Investments Llc
Bought by
Thompson Smith Ventures Llc
Purchase Details
Closed on
May 2, 2019
Sold by
Kern Morgan Barbara Joyce and Kern Morgan Michael
Bought by
Cloudbreak Investments Llc
Home Financials for this Owner
Home Financials are based on the most recent Mortgage that was taken out on this home.
Original Mortgage
$210,937
Interest Rate
4.2%
Mortgage Type
Commercial
Create a Home Valuation Report for This Property
The Home Valuation Report is an in-depth analysis detailing your home's value as well as a comparison with similar homes in the area
Home Values in the Area
Average Home Value in this Area
Purchase History
| Date | Buyer | Sale Price | Title Company |
|---|---|---|---|
| Wehbie Mary Pb | -- | None Available | |
| Worth Marshall B | $380,000 | None Available | |
| Thompson Smith Ventures Llc | $375,000 | None Available | |
| Cloudbreak Investments Llc | $563,000 | None Available |
Source: Public Records
Mortgage History
| Date | Status | Borrower | Loan Amount |
|---|---|---|---|
| Previous Owner | Worth Marshall B | $897,192 | |
| Previous Owner | Cloudbreak Investments Llc | $210,937 |
Source: Public Records
Tax History Compared to Growth
Tax History
| Year | Tax Paid | Tax Assessment Tax Assessment Total Assessment is a certain percentage of the fair market value that is determined by local assessors to be the total taxable value of land and additions on the property. | Land | Improvement |
|---|---|---|---|---|
| 2021 | $0 | $366,000 | $366,000 | $0 |
| 2020 | $3,496 | $366,000 | $366,000 | $0 |
| 2019 | $3,514 | $301,462 | $234,000 | $67,462 |
| 2018 | $3,314 | $301,462 | $234,000 | $67,462 |
| 2017 | $3,156 | $301,462 | $234,000 | $67,462 |
| 2016 | $3,091 | $301,462 | $234,000 | $67,462 |
| 2015 | $3,054 | $292,990 | $199,800 | $93,190 |
| 2014 | $2,897 | $292,990 | $199,800 | $93,190 |
Source: Public Records
Map
Nearby Homes
- 202 Georgetown Rd
- 308 E Whitaker Mill Rd
- 204 E Whitaker Mill Rd
- 400 Bryan Pointe Dr Unit 104
- 1610 Draper View Loop Unit 101
- 540 Ledbetter Ct
- 214 Hudson St
- 1523 1/2 Sunrise Ave
- 1523 Sunrise Ave
- 1521 1/2 Sunrise Ave
- 1521 Havenmont Ct
- 1521 Sunrise Ave
- 626 E Whitaker Mill Rd
- 1523 Havenmont Ct
- 1527 Urban Trace Ln
- 1525 Havenmont Ct
- 1525 Urban Trace Ln
- 1533 Urban Trace Ln
- 1523 Urban Trace Ln
- 606 Highpark Ln
- 1708 Carson St
- 1700 Carson St
- 203 Georgetown Rd
- 201 Georgetown Rd
- 203 1/2 Georgetown Rd
- 1710 Carson St
- 205 Georgetown Rd
- 1712 Carson St
- 127 Georgetown Rd
- 207 Georgetown Rd
- 1608 Carson St
- 506 E Whitaker Mill Rd
- 200 Georgetown Rd
- 1705 Carson St
- 508 E Whitaker Mill Rd
- 1707 Carson St
- 209 Georgetown Rd
- 1713 Carson St
- 123 Georgetown Rd
- 1609 Carson St