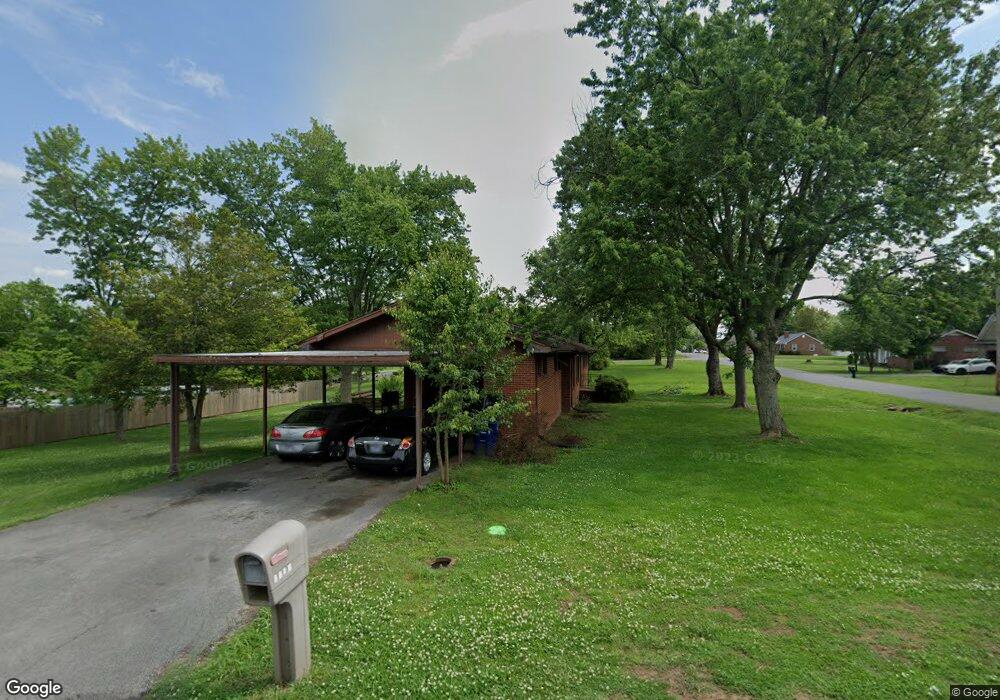
1704 Edmond Rd Shelbyville, TN 37160
Estimated Value: $241,000 - $273,000
--
Bed
2
Baths
1,168
Sq Ft
$216/Sq Ft
Est. Value
About This Home
This home is located at 1704 Edmond Rd, Shelbyville, TN 37160 and is currently estimated at $252,726, approximately $216 per square foot. 1704 Edmond Rd is a home located in Bedford County with nearby schools including Eakin Elementary School, Harris Middle School, and Victory Baptist Academy.
Ownership History
Date
Name
Owned For
Owner Type
Purchase Details
Closed on
May 24, 2017
Sold by
Farrar James E
Bought by
Perry Craig
Current Estimated Value
Purchase Details
Closed on
Jan 3, 2017
Sold by
Pinkston Mary M
Bought by
Farrar James E
Home Financials for this Owner
Home Financials are based on the most recent Mortgage that was taken out on this home.
Original Mortgage
$500,000
Interest Rate
4.13%
Mortgage Type
New Conventional
Purchase Details
Closed on
Apr 16, 2004
Sold by
Templeton David E
Bought by
Hughes Eloise P
Purchase Details
Closed on
Sep 16, 1961
Bought by
Templeton Willard F and Templeton Dorothy
Create a Home Valuation Report for This Property
The Home Valuation Report is an in-depth analysis detailing your home's value as well as a comparison with similar homes in the area
Home Values in the Area
Average Home Value in this Area
Purchase History
| Date | Buyer | Sale Price | Title Company |
|---|---|---|---|
| Perry Craig | $108,000 | -- | |
| Farrar James E | $103,500 | -- | |
| Hughes Eloise P | $84,000 | -- | |
| Templeton Willard F | -- | -- |
Source: Public Records
Mortgage History
| Date | Status | Borrower | Loan Amount |
|---|---|---|---|
| Previous Owner | Farrar James E | $500,000 |
Source: Public Records
Tax History Compared to Growth
Tax History
| Year | Tax Paid | Tax Assessment Tax Assessment Total Assessment is a certain percentage of the fair market value that is determined by local assessors to be the total taxable value of land and additions on the property. | Land | Improvement |
|---|---|---|---|---|
| 2025 | -- | $43,050 | $0 | $0 |
| 2024 | -- | $43,050 | $8,000 | $35,050 |
| 2023 | $1,638 | $43,050 | $8,000 | $35,050 |
| 2022 | $1,686 | $43,050 | $8,000 | $35,050 |
| 2021 | $1,531 | $43,050 | $8,000 | $35,050 |
| 2020 | $1,041 | $43,050 | $8,000 | $35,050 |
| 2019 | $1,041 | $23,500 | $4,000 | $19,500 |
| 2018 | $1,018 | $23,500 | $4,000 | $19,500 |
| 2017 | $1,018 | $23,500 | $4,000 | $19,500 |
| 2016 | $1,008 | $23,500 | $4,000 | $19,500 |
| 2015 | $1,008 | $23,500 | $4,000 | $19,500 |
| 2014 | $940 | $23,978 | $0 | $0 |
Source: Public Records
Map
Nearby Homes