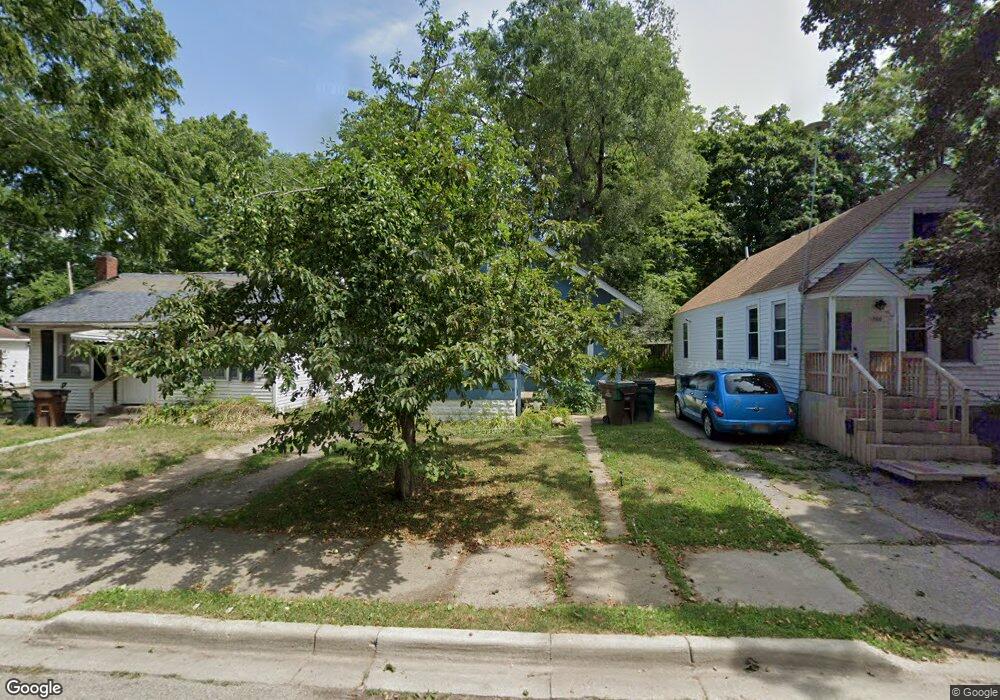
1704 Massachusetts Ave Lansing, MI 48906
Northtown NeighborhoodEstimated Value: $50,715 - $90,000
2
Beds
1
Bath
528
Sq Ft
$122/Sq Ft
Est. Value
About This Home
This home is located at 1704 Massachusetts Ave, Lansing, MI 48906 and is currently estimated at $64,179, approximately $121 per square foot. 1704 Massachusetts Ave is a home located in Ingham County with nearby schools including Gier Park School, Pattengill Academy, and Eastern Lansing High School.
Ownership History
Date
Name
Owned For
Owner Type
Purchase Details
Closed on
Aug 16, 2022
Sold by
Seaside Llc
Bought by
Smith Michael Joseph
Current Estimated Value
Home Financials for this Owner
Home Financials are based on the most recent Mortgage that was taken out on this home.
Original Mortgage
$39,285
Outstanding Balance
$37,558
Interest Rate
5.51%
Mortgage Type
New Conventional
Estimated Equity
$26,621
Purchase Details
Closed on
Sep 28, 2006
Sold by
Daugard Darin
Bought by
U S Bank Na
Purchase Details
Closed on
Jan 16, 2004
Sold by
Thompson Kevin T
Bought by
Daugard Darin
Home Financials for this Owner
Home Financials are based on the most recent Mortgage that was taken out on this home.
Original Mortgage
$45,000
Interest Rate
6.75%
Mortgage Type
Purchase Money Mortgage
Purchase Details
Closed on
Jun 19, 1997
Bought by
Thompson Kevin
Create a Home Valuation Report for This Property
The Home Valuation Report is an in-depth analysis detailing your home's value as well as a comparison with similar homes in the area
Home Values in the Area
Average Home Value in this Area
Purchase History
| Date | Buyer | Sale Price | Title Company |
|---|---|---|---|
| Smith Michael Joseph | $40,500 | -- | |
| U S Bank Na | $37,500 | None Available | |
| Daugard Darin | $50,000 | Chicago Title | |
| Thompson Kevin | $7,000 | -- |
Source: Public Records
Mortgage History
| Date | Status | Borrower | Loan Amount |
|---|---|---|---|
| Open | Smith Michael Joseph | $39,285 | |
| Previous Owner | Daugard Darin | $45,000 | |
| Closed | Smith Michael Joseph | $3,000 |
Source: Public Records
Tax History Compared to Growth
Tax History
| Year | Tax Paid | Tax Assessment Tax Assessment Total Assessment is a certain percentage of the fair market value that is determined by local assessors to be the total taxable value of land and additions on the property. | Land | Improvement |
|---|---|---|---|---|
| 2025 | $2,351 | $33,900 | $2,300 | $31,600 |
| 2024 | $20 | $28,600 | $2,300 | $26,300 |
| 2023 | $1,576 | $23,400 | $2,300 | $21,100 |
| 2022 | $1,436 | $23,000 | $2,400 | $20,600 |
| 2021 | $1,403 | $20,800 | $3,300 | $17,500 |
| 2020 | $1,393 | $19,300 | $3,300 | $16,000 |
| 2019 | $2,387 | $18,500 | $3,300 | $15,200 |
| 2018 | $1,276 | $16,700 | $3,300 | $13,400 |
| 2017 | $1,227 | $16,700 | $3,300 | $13,400 |
| 2016 | $2,830 | $15,600 | $3,300 | $12,300 |
| 2015 | $2,830 | $15,300 | $6,651 | $8,649 |
| 2014 | $2,830 | $15,100 | $6,651 | $8,449 |
Source: Public Records
Map
Nearby Homes
- 1614 Vermont Ave
- 1633 Illinois Ave
- 1811 Vermont Ave
- 1530 New York Ave
- 1624 N High St
- 1810 N High St
- 1548 N High St
- 1415 New York Ave
- 1318 Massachusetts Ave
- 1407 New York Ave
- 0 Lake Lansing Rd
- 1141 Farrand St
- 1127 Camp St
- 1919 N East St
- 1312 Otto St
- 614 Woodbury Ave
- V/L (1036) N Larch St
- 1206 Porter St
- 928 Porter St
- 801 Banghart St
- 1706 Massachusetts Ave
- 1700 Massachusetts Ave
- 1634 Massachusetts Ave
- 1712 Massachusetts Ave
- 1705 Vermont Ave
- 1639 Vermont Ave
- 1718 Massachusetts Ave
- 1635 Vermont Ave
- 1711 Vermont Ave
- 1633 Vermont Ave
- 1630 Massachusetts Ave
- 1705 Massachusetts Ave
- 1719 Vermont Ave
- 1707 Massachusetts Ave
- 1208 Whyte St
- 1627 Vermont Ave
- 1713 Massachusetts Ave
- 1210 Whyte St
- 1633 Massachusetts Ave
- 1722 Massachusetts Ave