1704 Santa fe S Unit 715 Osie Wichita, KS 67211
South Central NeighborhoodEstimated Value: $298,000 - $303,498
5
Beds
3
Baths
4,386
Sq Ft
$69/Sq Ft
Est. Value
About This Home
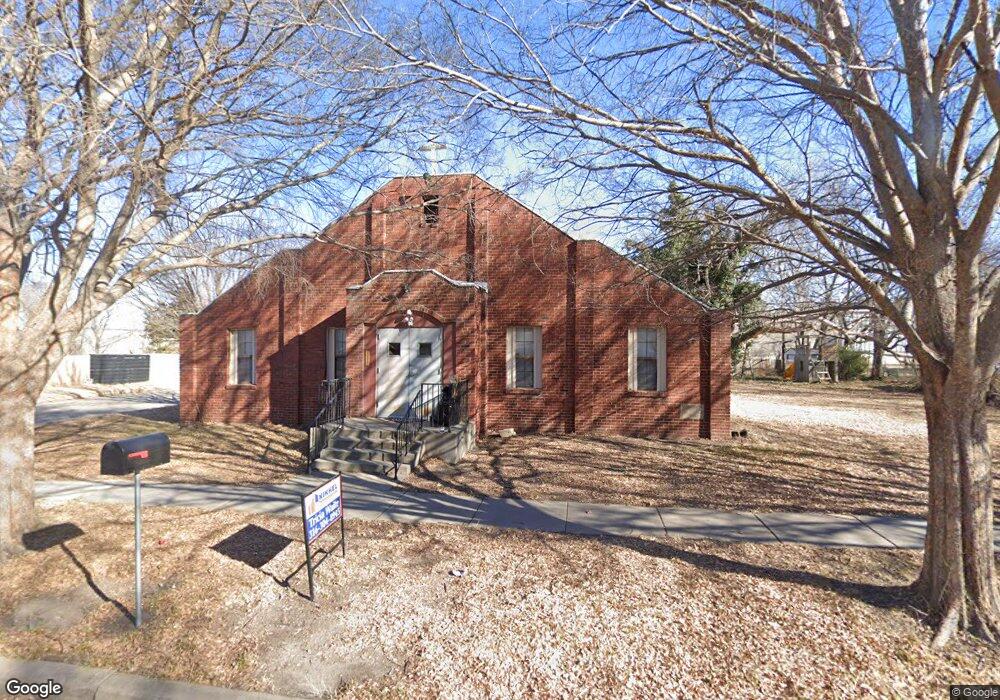
This home is located at 1704 Santa fe S Unit 715 Osie, Wichita, KS 67211 and is currently estimated at $300,749, approximately $68 per square foot. 1704 Santa fe S Unit 715 Osie is a home located in Sedgwick County with nearby schools including Gardiner Elementary School, Hamilton Middle School, and Wichita West High School.
Ownership History
Date
Name
Owned For
Owner Type
Purchase Details
Closed on
May 5, 2025
Sold by
Chelsea Dobbins Llc
Bought by
York Braden
Current Estimated Value
Home Financials for this Owner
Home Financials are based on the most recent Mortgage that was taken out on this home.
Original Mortgage
$306,450
Outstanding Balance
$305,365
Interest Rate
6.65%
Mortgage Type
VA
Estimated Equity
-$4,616
Purchase Details
Closed on
Oct 26, 2023
Sold by
Chelsea Dobbins Llc
Bought by
Allen Joseph
Purchase Details
Closed on
Jul 17, 2023
Sold by
Wichita Brewing Company Production Llc
Bought by
Chelsea Dobbins Llc
Home Financials for this Owner
Home Financials are based on the most recent Mortgage that was taken out on this home.
Original Mortgage
$183,500
Interest Rate
6.79%
Mortgage Type
Credit Line Revolving
Create a Home Valuation Report for This Property
The Home Valuation Report is an in-depth analysis detailing your home's value as well as a comparison with similar homes in the area
Home Values in the Area
Average Home Value in this Area
Purchase History
| Date | Buyer | Sale Price | Title Company |
|---|---|---|---|
| York Braden | -- | Security 1St Title | |
| Allen Joseph | -- | Security 1St Title | |
| Chelsea Dobbins Llc | -- | Security 1St Title |
Source: Public Records
Mortgage History
| Date | Status | Borrower | Loan Amount |
|---|---|---|---|
| Open | York Braden | $306,450 | |
| Previous Owner | Chelsea Dobbins Llc | $183,500 |
Source: Public Records
Tax History Compared to Growth
Tax History
| Year | Tax Paid | Tax Assessment Tax Assessment Total Assessment is a certain percentage of the fair market value that is determined by local assessors to be the total taxable value of land and additions on the property. | Land | Improvement |
|---|---|---|---|---|
| 2025 | $1,016 | $2,451 | $2,082 | $369 |
| 2024 | $1,016 | $10,305 | $1,530 | $8,775 |
| 2023 | $1,016 | $15,379 | $3,085 | $12,294 |
| 2022 | $1,615 | $14,764 | $3,085 | $11,679 |
| 2021 | $1,645 | $14,500 | $3,085 | $11,415 |
| 2020 | $1,579 | $13,879 | $3,085 | $10,794 |
| 2019 | $1,539 | $13,514 | $3,085 | $10,429 |
| 2018 | $1,533 | $13,422 | $3,085 | $10,337 |
| 2017 | $1,505 | $0 | $0 | $0 |
| 2016 | $3,466 | $0 | $0 | $0 |
| 2015 | -- | $0 | $0 | $0 |
| 2014 | -- | $0 | $0 | $0 |
Source: Public Records
Map
Nearby Homes
- 1732 S Santa fe St
- 1702 S Emporia St
- 0000 E Boston
- 1805 S Topeka Ave
- 1825 & 1827 S Topeka
- 1928 S Mosley St
- 1808 S Laura Ave
- 1948 S Topeka Ave
- 1944 S Broadway St
- 1515 S Market St
- 1321 E Osie St
- 1534 S Main St
- 1324 S Emporia St
- 2032 S Topeka Ave
- 1345 S Ida St
- 1425 S Market St
- 1930 S Main St
- 1938 S Pattie St
- 1550 S Water St
- 1421 S Pattie St
- 1704 Santa fe S Unit 715 E. Osie St.
- 1710 S Santa fe St
- 1658 S Santa fe St
- 1714 S Santa fe St
- 1701 S Santa fe St
- 1707 S Santa fe St
- 1713 S Santa fe St
- 1657 S Santa fe St
- 1718 S Santa fe St
- 1715 S Santa fe St
- 1648 S Santa fe St
- 619 E Osie St
- 1722 S Santa fe St
- 1723 S Santa fe St
- 1637 S Santa fe St
- 1634 S Santa fe St
- 1726 S Santa fe St
- 1633 S Santa fe St
- 1725 S Santa fe St
- 1622 S Santa fe St