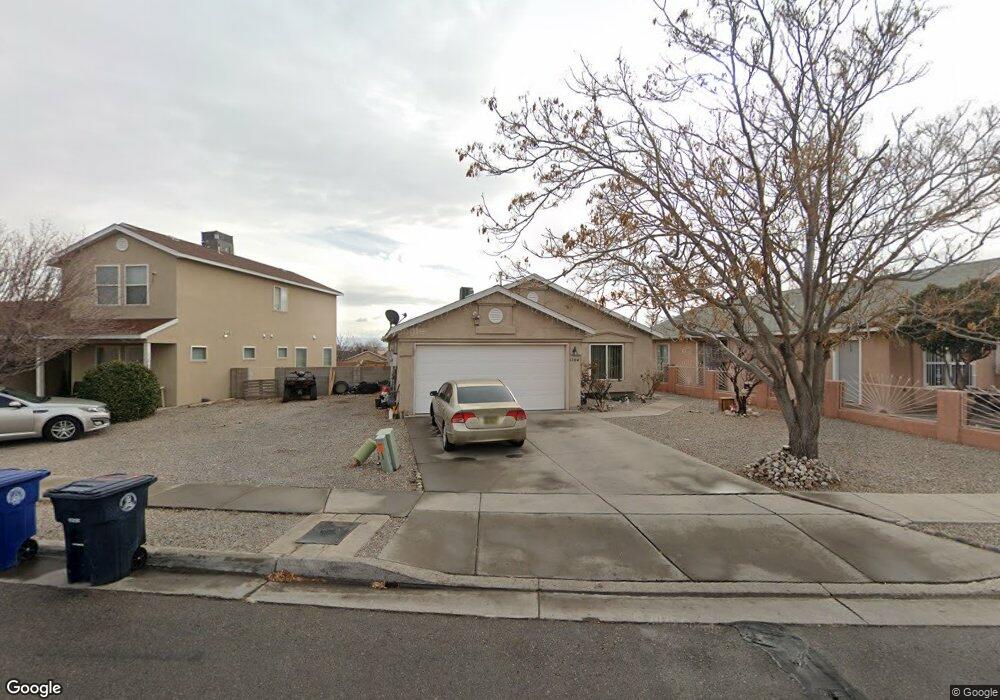
1704 Summerfield Place SW Unit 3 Albuquerque, NM 87121
Southwest Heights NeighborhoodEstimated Value: $221,000 - $252,880
3
Beds
2
Baths
1,045
Sq Ft
$229/Sq Ft
Est. Value
About This Home
This home is located at 1704 Summerfield Place SW Unit 3, Albuquerque, NM 87121 and is currently estimated at $239,220, approximately $228 per square foot. 1704 Summerfield Place SW Unit 3 is a home located in Bernalillo County with nearby schools including Maryann Binford Elementary School, Truman Middle School, and Atrisco Heritage Academy High School.
Ownership History
Date
Name
Owned For
Owner Type
Purchase Details
Closed on
Mar 7, 2019
Sold by
Monaghan Sigrid Z
Bought by
Medrano Garcia Isaias
Current Estimated Value
Home Financials for this Owner
Home Financials are based on the most recent Mortgage that was taken out on this home.
Original Mortgage
$70,000
Outstanding Balance
$61,417
Interest Rate
4.4%
Mortgage Type
New Conventional
Estimated Equity
$177,803
Purchase Details
Closed on
Dec 14, 2004
Sold by
Artistic Homes Inc
Bought by
Monaghan Sigrid Z
Home Financials for this Owner
Home Financials are based on the most recent Mortgage that was taken out on this home.
Original Mortgage
$96,360
Interest Rate
5.7%
Mortgage Type
Purchase Money Mortgage
Purchase Details
Closed on
May 1, 2001
Sold by
Curb Inc
Bought by
Artistic Homes Inc
Create a Home Valuation Report for This Property
The Home Valuation Report is an in-depth analysis detailing your home's value as well as a comparison with similar homes in the area
Home Values in the Area
Average Home Value in this Area
Purchase History
| Date | Buyer | Sale Price | Title Company |
|---|---|---|---|
| Medrano Garcia Isaias | -- | Fidelity National Ttl Ins Co | |
| Monaghan Sigrid Z | -- | First American Title Ins Co | |
| Artistic Homes Inc | -- | First American Title Ins Co |
Source: Public Records
Mortgage History
| Date | Status | Borrower | Loan Amount |
|---|---|---|---|
| Open | Medrano Garcia Isaias | $70,000 | |
| Previous Owner | Monaghan Sigrid Z | $96,360 |
Source: Public Records
Tax History Compared to Growth
Tax History
| Year | Tax Paid | Tax Assessment Tax Assessment Total Assessment is a certain percentage of the fair market value that is determined by local assessors to be the total taxable value of land and additions on the property. | Land | Improvement |
|---|---|---|---|---|
| 2025 | $1,696 | $41,413 | $9,940 | $31,473 |
| 2024 | $1,696 | $40,208 | $9,651 | $30,557 |
| 2023 | $2,571 | $39,037 | $9,370 | $29,667 |
| 2022 | $1,612 | $37,900 | $9,097 | $28,803 |
| 2021 | $1,558 | $36,796 | $8,832 | $27,964 |
| 2020 | $1,533 | $35,729 | $8,832 | $26,897 |
| 2019 | $1,321 | $30,797 | $9,940 | $20,857 |
| 2018 | $1,274 | $30,797 | $9,940 | $20,857 |
| 2017 | $1,235 | $29,901 | $9,651 | $20,250 |
| 2016 | $1,199 | $28,184 | $9,097 | $19,087 |
| 2015 | $27,363 | $27,363 | $8,832 | $18,531 |
| 2014 | $1,170 | $27,563 | $8,832 | $18,731 |
| 2013 | -- | $27,797 | $8,832 | $18,965 |
Source: Public Records
Map
Nearby Homes
- 7901 Purple Fringe Rd SW
- 8600 Kimela Ct SW
- 2503 Sancho Panza Way SW
- 7814 Desert Canyon Place SW
- 1420 Summerfield Place SW
- 8524 Stony Creek Rd SW
- 1815 Shadetree Dr SW
- 4301 Blake Trailer 40 Rd SW
- 7304 Autumn Sky Rd SW
- 1209 Locura Rd SW
- 2771 Butch Cassidy Dr SW
- 1615 Quiet Desert Dr SW
- 2724 Barcelona Place SW
- 9300 Jenny Ave SW
- 8709 Rhonda Ave SW
- 9909 Saddlehorn Trail SW
- 1327 Amole Vista St SW
- 9808 Morning Sun Trail SW
- 9901 Morning Sun Trail SW
- 3855 Villa Serena Place SW
- 1704 Summerfield Place SW
- 1700 Summerfield Place SW
- 1708 Summerfield Place SW
- 1708 Summerfield Place SW Unit 3
- 1712 Summerfield Place SW
- 1712 Summerfield Place SW Unit 3
- 1800 Summerfield Place SW
- 1709 Summerfield Place SW
- 1804 Summerfield Place SW
- 1808 Summerfield Place SW
- 1905 Summerfield Place SW
- 2319 Native Flower Place SW
- 2311 Native Flower Place SW
- 2315 Native Flower Place SW
- 2401 Native Flower Place SW
- 1812 Summerfield Place SW
- 2309 Native Flower Place SW
- 2405 Native Flower Place SW
- 1909 Summerfield Place SW
- 2305 Native Flower Place SW