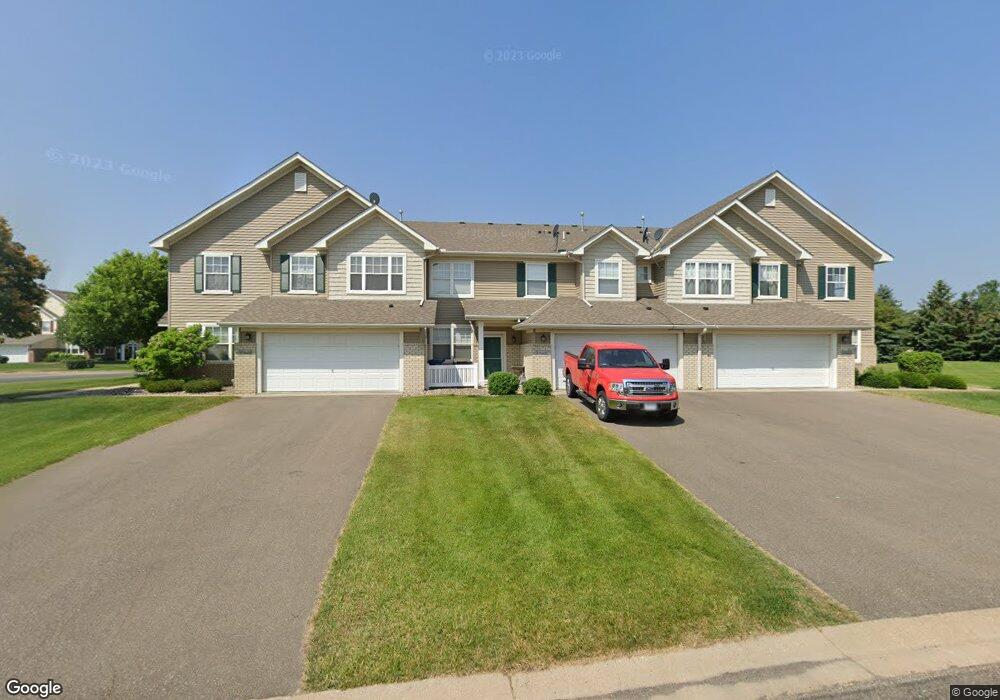
17043 Embers Ave Unit 2402 Farmington, MN 55024
Estimated Value: $252,064 - $268,000
2
Beds
2
Baths
1,449
Sq Ft
$177/Sq Ft
Est. Value
About This Home
This home is located at 17043 Embers Ave Unit 2402, Farmington, MN 55024 and is currently estimated at $257,016, approximately $177 per square foot. 17043 Embers Ave Unit 2402 is a home located in Dakota County with nearby schools including North Trail Elementary School, Levi P. Dodge Middle School, and Farmington High School.
Ownership History
Date
Name
Owned For
Owner Type
Purchase Details
Closed on
Dec 22, 2021
Sold by
Wick Noah R
Bought by
Deluney Troy and Deluney Maria
Current Estimated Value
Home Financials for this Owner
Home Financials are based on the most recent Mortgage that was taken out on this home.
Original Mortgage
$180,000
Outstanding Balance
$165,263
Interest Rate
2.98%
Mortgage Type
New Conventional
Estimated Equity
$91,753
Purchase Details
Closed on
May 11, 2018
Sold by
Koenig Alyssa A and Koenig Eric B
Bought by
Wick Noah R and Wick Darryl R
Home Financials for this Owner
Home Financials are based on the most recent Mortgage that was taken out on this home.
Original Mortgage
$175,750
Interest Rate
4.4%
Mortgage Type
New Conventional
Purchase Details
Closed on
Oct 26, 2004
Sold by
Town & Country Homes Inc
Bought by
Harris Linda and Harris Alyssa
Create a Home Valuation Report for This Property
The Home Valuation Report is an in-depth analysis detailing your home's value as well as a comparison with similar homes in the area
Home Values in the Area
Average Home Value in this Area
Purchase History
| Date | Buyer | Sale Price | Title Company |
|---|---|---|---|
| Deluney Troy | $240,000 | First American Title Insu | |
| Wick Noah R | $185,000 | Burnet Title | |
| Harris Linda | $168,470 | -- |
Source: Public Records
Mortgage History
| Date | Status | Borrower | Loan Amount |
|---|---|---|---|
| Open | Deluney Troy | $180,000 | |
| Previous Owner | Wick Noah R | $175,750 |
Source: Public Records
Tax History Compared to Growth
Tax History
| Year | Tax Paid | Tax Assessment Tax Assessment Total Assessment is a certain percentage of the fair market value that is determined by local assessors to be the total taxable value of land and additions on the property. | Land | Improvement |
|---|---|---|---|---|
| 2024 | $2,638 | $244,500 | $53,300 | $191,200 |
| 2023 | $2,638 | $244,900 | $53,100 | $191,800 |
| 2022 | $2,594 | $240,000 | $52,900 | $187,100 |
| 2021 | $2,474 | $206,000 | $46,000 | $160,000 |
| 2020 | $2,466 | $190,200 | $43,800 | $146,400 |
| 2019 | $2,008 | $183,000 | $41,700 | $141,300 |
| 2018 | $1,840 | $167,200 | $38,600 | $128,600 |
| 2017 | $1,708 | $153,100 | $35,800 | $117,300 |
| 2016 | $1,691 | $140,700 | $34,100 | $106,600 |
| 2015 | $1,544 | $110,346 | $26,649 | $83,697 |
| 2014 | -- | $109,256 | $25,688 | $83,568 |
| 2013 | -- | $91,271 | $21,598 | $69,673 |
Source: Public Records
Map
Nearby Homes
- 16915 Embers Ave Unit 1204
- 5377 172nd St W Unit 2002
- 5387 172nd St W Unit 2006
- 16793 Embers Ave Unit 606
- 16809 Embers Ave Unit 702
- 16895 Embers Ave
- 17141 Eagleview Way Unit 69
- 17207 Encina Path
- 16770 Embers Ave
- 17054 Eagleview Way
- 17085 Eastwood Ave Unit 116
- 17090 Eastwood Ave Unit 104
- The Clayton Plan at Brookshire - Express Premier
- 17232 Durham Dr
- The Bryant II Plan at Brookshire - Express Premier
- The Cameron II Plan at Brookshire - Express Premier
- The Finnegan Plan at Brookshire - Express Premier
- The Rushmore Plan at Brookshire - Express Premier
- 17373 N Creek Dr
- 5215 167th St W
- 17043 Embers Ave
- 17045 17045 Embers Ave
- 17067 Encina Path
- 17045 Embers Ave
- 17045 Embers Ave Unit 2401
- 17065 Encina Path
- 17065 Encina Path Unit 2406
- 17041 Embers Ave
- 17041 Embers Ave Unit 2403
- 17069 Encina Path
- 17069 Encina Path
- 17075 Encina Path
- 17077 Encina Path
- 17079 Encina Path
- 17056 Embers Ave Unit 1504
- 17064 Encina Path Unit 1505
- 17064 Encina Path
- 17083 Encina Path
- 17085 Encina Path
- 17085 Encina Path