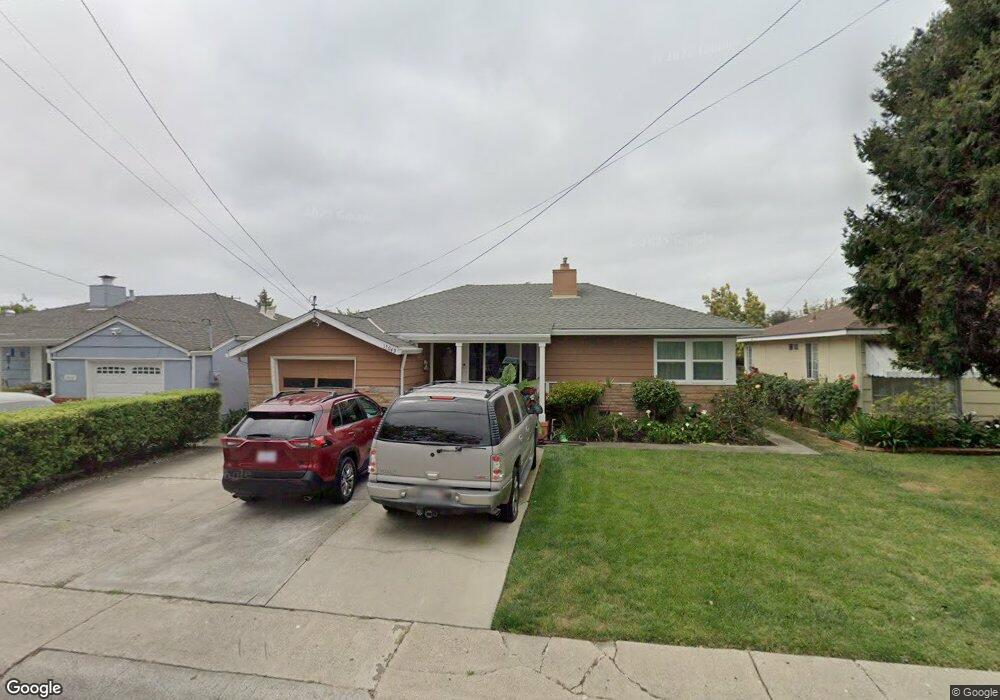
17049 Via Alamitos San Lorenzo, CA 94580
Estimated Value: $820,000 - $871,000
3
Beds
1
Bath
1,451
Sq Ft
$580/Sq Ft
Est. Value
About This Home
This home is located at 17049 Via Alamitos, San Lorenzo, CA 94580 and is currently estimated at $841,782, approximately $580 per square foot. 17049 Via Alamitos is a home located in Alameda County with nearby schools including Del Rey Elementary School, Bohannon Middle School, and Arroyo High School.
Ownership History
Date
Name
Owned For
Owner Type
Purchase Details
Closed on
Aug 14, 2002
Sold by
Sera Roberto
Bought by
Sera Sabina
Current Estimated Value
Home Financials for this Owner
Home Financials are based on the most recent Mortgage that was taken out on this home.
Original Mortgage
$272,000
Outstanding Balance
$134,782
Interest Rate
8.99%
Estimated Equity
$707,000
Purchase Details
Closed on
Aug 3, 2002
Sold by
Phipps Marlene Trudy and Phipps Thomas Raymond
Bought by
Sera Sabina
Home Financials for this Owner
Home Financials are based on the most recent Mortgage that was taken out on this home.
Original Mortgage
$272,000
Outstanding Balance
$134,782
Interest Rate
8.99%
Estimated Equity
$707,000
Purchase Details
Closed on
Apr 11, 1997
Sold by
Phipps Raymond P
Bought by
Phipps Marlene Trudy and Phipps Thomas Raymond
Home Financials for this Owner
Home Financials are based on the most recent Mortgage that was taken out on this home.
Original Mortgage
$60,000
Interest Rate
7.86%
Create a Home Valuation Report for This Property
The Home Valuation Report is an in-depth analysis detailing your home's value as well as a comparison with similar homes in the area
Home Values in the Area
Average Home Value in this Area
Purchase History
| Date | Buyer | Sale Price | Title Company |
|---|---|---|---|
| Sera Sabina | -- | Chicago Title Co | |
| Sera Sabina | $340,000 | Chicago Title Co | |
| Phipps Marlene Trudy | $25,454 | Fidelity National Title Co |
Source: Public Records
Mortgage History
| Date | Status | Borrower | Loan Amount |
|---|---|---|---|
| Open | Sera Sabina | $272,000 | |
| Previous Owner | Phipps Marlene Trudy | $60,000 | |
| Closed | Sera Sabina | $68,000 |
Source: Public Records
Tax History Compared to Growth
Tax History
| Year | Tax Paid | Tax Assessment Tax Assessment Total Assessment is a certain percentage of the fair market value that is determined by local assessors to be the total taxable value of land and additions on the property. | Land | Improvement |
|---|---|---|---|---|
| 2025 | $6,527 | $492,387 | $147,716 | $344,671 |
| 2024 | $6,527 | $482,734 | $144,820 | $337,914 |
| 2023 | $6,498 | $473,272 | $141,981 | $331,291 |
| 2022 | $6,401 | $463,994 | $139,198 | $324,796 |
| 2021 | $6,595 | $454,898 | $136,469 | $318,429 |
| 2020 | $6,091 | $450,237 | $135,071 | $315,166 |
| 2019 | $6,611 | $441,411 | $132,423 | $308,988 |
| 2018 | $6,019 | $432,758 | $129,827 | $302,931 |
| 2017 | $5,599 | $424,275 | $127,282 | $296,993 |
| 2016 | $5,246 | $415,958 | $124,787 | $291,171 |
| 2015 | $5,132 | $409,713 | $122,914 | $286,799 |
| 2014 | $5,194 | $401,688 | $120,506 | $281,182 |
Source: Public Records
Map
Nearby Homes
- 17069 Via Chiquita
- 1311 Via Manzanas
- 16050 Via Olinda
- 17316 Via Flores
- 17347 Via Encinas
- 16011 Via Conejo
- 15967 Paseo Del Campo
- 1338 Via la Paloma
- 1608 Keller Ave
- 1575 Via Lucas
- 0 E 14th St Unit 41059501
- 17354 Via el Cerrito
- 17761 Via Arriba
- 18003 Incline Place
- 18018 Sahara Rd
- 1631 Via Ventana
- 1766 Via Redondo
- 1655 Via Escondido
- 1867 Via Buena Vista
- 15867 Hesperian Blvd
- 17041 Via Alamitos
- 17057 Via Alamitos
- 17050 Via Margarita
- 17065 Via Alamitos
- 17033 Via Alamitos
- 17058 Via Margarita
- 17042 Via Margarita
- 17066 Via Margarita
- 17034 Via Margarita
- 17048 Via Alamitos
- 17040 Via Alamitos
- 17073 Via Alamitos
- 17025 Via Alamitos
- 17064 Via Alamitos
- 17032 Via Alamitos
- 17074 Via Margarita
- 17026 Via Margarita
- 17072 Via Alamitos
- 17024 Via Alamitos
- 17081 Via Alamitos