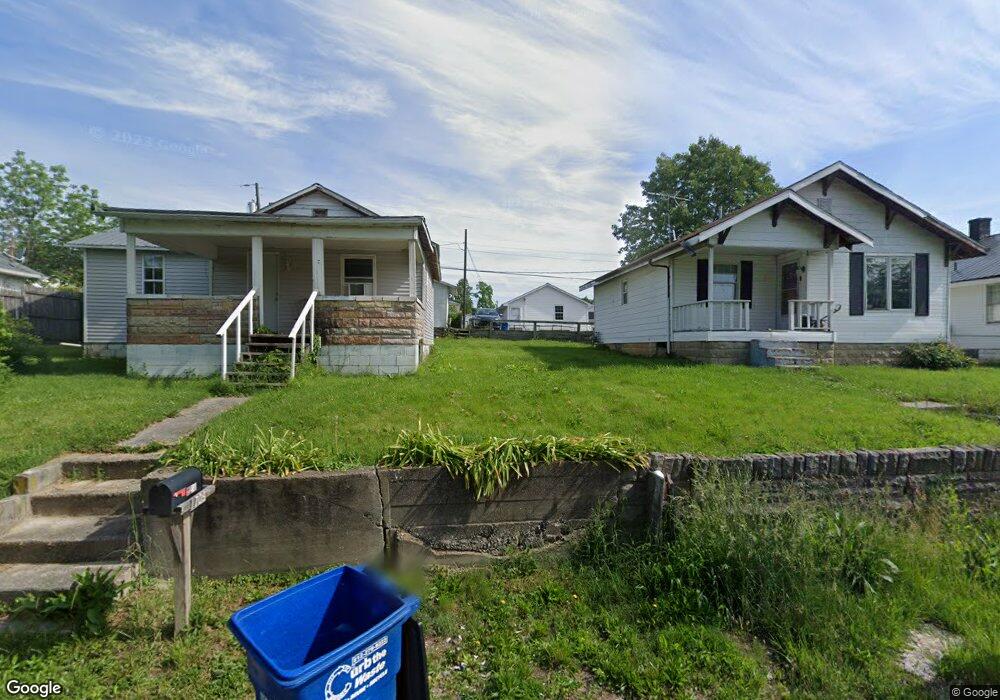
1705 25th St Bedford, IN 47421
Estimated Value: $148,000 - $279,000
3
Beds
1
Bath
1,260
Sq Ft
$158/Sq Ft
Est. Value
About This Home
This home is located at 1705 25th St, Bedford, IN 47421 and is currently estimated at $198,508, approximately $157 per square foot. 1705 25th St is a home located in Lawrence County with nearby schools including Bedford North Lawrence High School, St. Vincent de Paul School, and Stone City Christian Academy.
Ownership History
Date
Name
Owned For
Owner Type
Purchase Details
Closed on
May 9, 2018
Sold by
Taylor Bailey
Bought by
Nethery Mark
Current Estimated Value
Purchase Details
Closed on
Jun 14, 2012
Sold by
Us Bank National Association As Succe
Bought by
Nethery Mark and Taylor Bailey
Purchase Details
Closed on
Feb 14, 2012
Sold by
Samuel J Craig Of Lawrence County
Bought by
Us Bank National Association
Purchase Details
Closed on
Jan 31, 2007
Sold by
Haste William and Haste Dorothy
Bought by
Diehl Reva Jane
Create a Home Valuation Report for This Property
The Home Valuation Report is an in-depth analysis detailing your home's value as well as a comparison with similar homes in the area
Home Values in the Area
Average Home Value in this Area
Purchase History
| Date | Buyer | Sale Price | Title Company |
|---|---|---|---|
| Nethery Mark | -- | -- | |
| Nethery Mark | -- | -- | |
| Us Bank National Association | $44,100 | Doyle Legal Corporation | |
| Us Bank National Association | $44,100 | -- | |
| Diehl Reva Jane | $57,000 | Classic Title 1108 5Th St Be |
Source: Public Records
Tax History
| Year | Tax Paid | Tax Assessment Tax Assessment Total Assessment is a certain percentage of the fair market value that is determined by local assessors to be the total taxable value of land and additions on the property. | Land | Improvement |
|---|---|---|---|---|
| 2025 | $1,120 | $117,200 | $9,100 | $108,100 |
| 2024 | $1,120 | $112,000 | $8,900 | $103,100 |
| 2023 | $981 | $99,500 | $8,600 | $90,900 |
| 2022 | $941 | $93,100 | $8,400 | $84,700 |
| 2021 | $782 | $83,800 | $8,100 | $75,700 |
| 2020 | $677 | $79,000 | $7,800 | $71,200 |
| 2019 | $746 | $74,800 | $7,600 | $67,200 |
| 2018 | $724 | $72,700 | $7,400 | $65,300 |
| 2017 | $690 | $69,300 | $7,300 | $62,000 |
| 2016 | $661 | $67,000 | $7,100 | $59,900 |
| 2014 | $628 | $65,400 | $7,100 | $58,300 |
Source: Public Records
Map
Nearby Homes
Your Personal Tour Guide
Ask me questions while you tour the home.