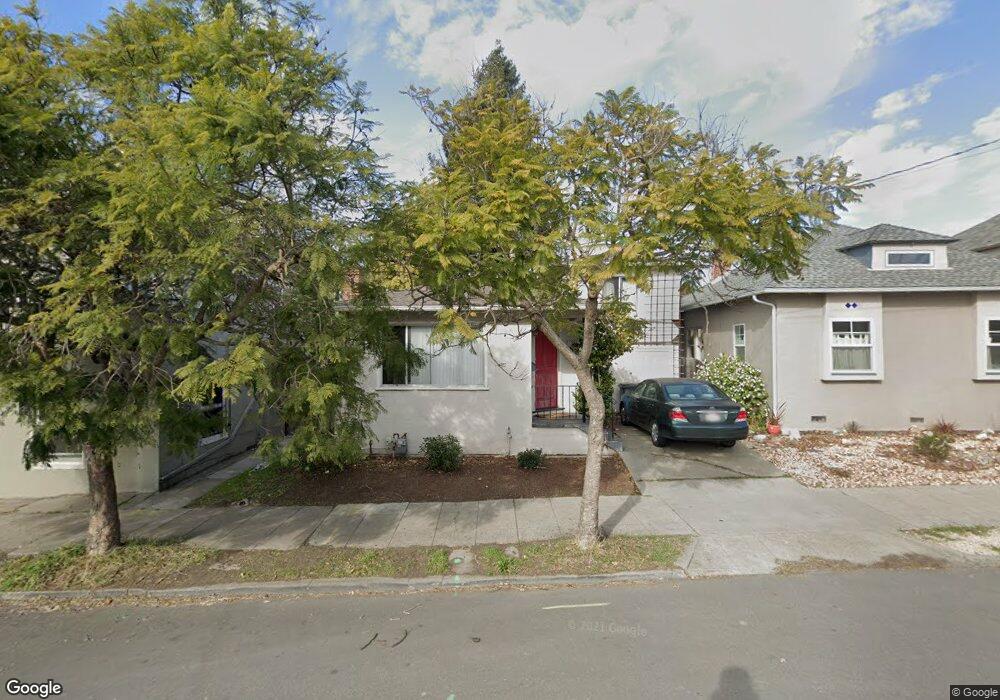
1705 Allston Way Berkeley, CA 94703
Downtown Berkeley NeighborhoodEstimated Value: $1,023,000 - $1,130,000
3
Beds
1
Bath
942
Sq Ft
$1,136/Sq Ft
Est. Value
About This Home
This home is located at 1705 Allston Way, Berkeley, CA 94703 and is currently estimated at $1,069,936, approximately $1,135 per square foot. 1705 Allston Way is a home located in Alameda County with nearby schools including Washington Elementary School, Berkeley Arts Magnet at Whittier School, and Oxford Elementary School.
Ownership History
Date
Name
Owned For
Owner Type
Purchase Details
Closed on
Nov 25, 2022
Sold by
Tseng Charles Cheng Chung
Bought by
Tseng Family Trust
Current Estimated Value
Purchase Details
Closed on
Jan 2, 2001
Sold by
Mackey Neil W
Bought by
Tseng Charles C and Tseng Doris W
Purchase Details
Closed on
Oct 15, 1997
Sold by
Ju M Sudduth James N and Ju Sudduthklinger
Bought by
Mackey Neil William
Home Financials for this Owner
Home Financials are based on the most recent Mortgage that was taken out on this home.
Original Mortgage
$176,250
Interest Rate
7.49%
Purchase Details
Closed on
Oct 9, 1997
Sold by
Mackay Anja S
Bought by
Mackey Neill William
Home Financials for this Owner
Home Financials are based on the most recent Mortgage that was taken out on this home.
Original Mortgage
$176,250
Interest Rate
7.49%
Create a Home Valuation Report for This Property
The Home Valuation Report is an in-depth analysis detailing your home's value as well as a comparison with similar homes in the area
Home Values in the Area
Average Home Value in this Area
Purchase History
| Date | Buyer | Sale Price | Title Company |
|---|---|---|---|
| Tseng Family Trust | -- | -- | |
| Tseng Charles C | $380,000 | New Century Title Company | |
| Mackey Neil William | $235,000 | Fidelity National Title Co | |
| Mackey Neill William | -- | Fidelity National Title Co |
Source: Public Records
Mortgage History
| Date | Status | Borrower | Loan Amount |
|---|---|---|---|
| Previous Owner | Mackey Neil William | $176,250 | |
| Closed | Mackey Neil William | $32,250 |
Source: Public Records
Tax History Compared to Growth
Tax History
| Year | Tax Paid | Tax Assessment Tax Assessment Total Assessment is a certain percentage of the fair market value that is determined by local assessors to be the total taxable value of land and additions on the property. | Land | Improvement |
|---|---|---|---|---|
| 2025 | $9,273 | $572,557 | $171,767 | $400,790 |
| 2024 | $9,273 | $561,331 | $168,399 | $392,932 |
| 2023 | $9,024 | $550,327 | $165,098 | $385,229 |
| 2022 | $8,808 | $539,538 | $161,861 | $377,677 |
| 2021 | $8,830 | $528,960 | $158,688 | $370,272 |
| 2020 | $8,413 | $523,537 | $157,061 | $366,476 |
| 2019 | $8,132 | $513,273 | $153,982 | $359,291 |
| 2018 | $7,989 | $503,210 | $150,963 | $352,247 |
| 2017 | $7,704 | $493,345 | $148,003 | $345,342 |
| 2016 | $7,472 | $483,674 | $145,102 | $338,572 |
| 2015 | $7,369 | $476,413 | $142,924 | $333,489 |
| 2014 | $7,315 | $467,084 | $140,125 | $326,959 |
Source: Public Records
Map
Nearby Homes
- 2201 McGee Ave
- 1718 Bancroft Way
- 2218 -2222 Grant St
- 2118 California St
- 2201 Spaulding Ave
- 1929 California St
- 1907 McGee Ave
- 2230 Sacramento St
- 1626 Dwight Way
- 1906 Bonita Ave
- 1436 Delaware St
- 2533 Grant St
- 1360 Berkeley Way
- 1516 Blake St
- 1516 Blake St Unit A
- 1431 Dwight Way
- 1612 Parker St
- 1901 Parker St Unit 3
- 1819 Carleton St
- 1612 Carleton St
- 1709 Allston Way
- 1701 Allston Way
- 2147 McGee Ave
- 1711 Allston Way
- 1713 Allston Way
- 1717 Allston Way
- 38115 Magee Rd
- 1710 Allston Way
- 2141 McGee Ave
- 2140 Roosevelt Ave
- 1712 Allston Way
- 2203 McGee Ave
- 1647 Allston Way
- 1723 Allston Way
- 2136 McGee Ave
- 2205 McGee Ave
- 2204 Roosevelt Ave
- 2132 Roosevelt Ave Unit 7
- 1645 Allston Way
- 2206 Roosevelt Ave