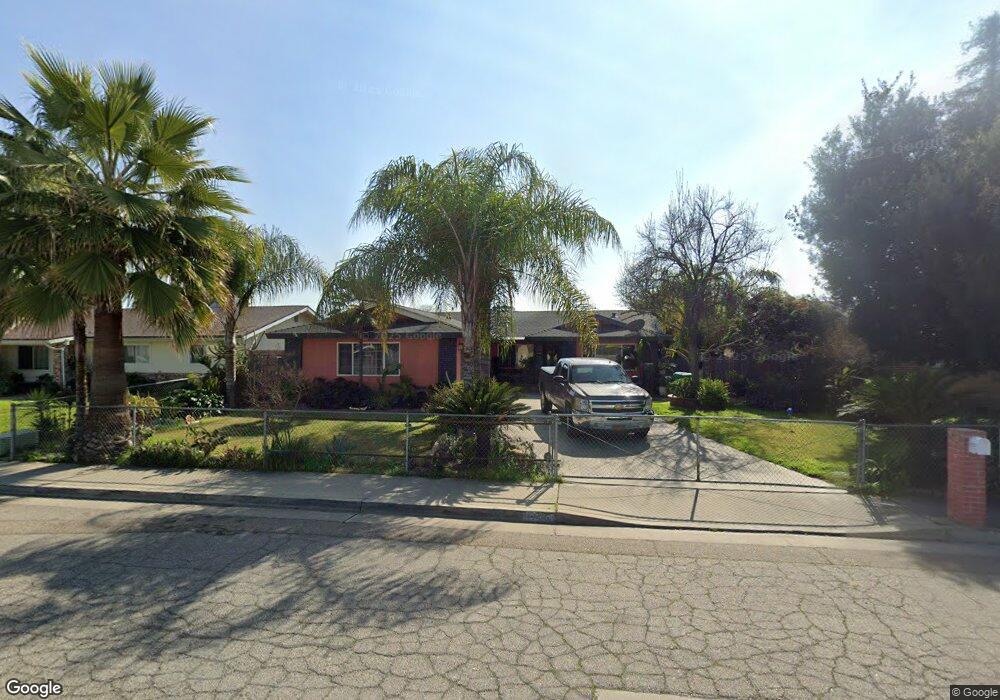
1705 Bel Aire Ave Porterville, CA 93257
Porterville Northwest NeighborhoodEstimated Value: $314,523 - $356,000
3
Beds
2
Baths
1,440
Sq Ft
$237/Sq Ft
Est. Value
About This Home
This home is located at 1705 Bel Aire Ave, Porterville, CA 93257 and is currently estimated at $341,381, approximately $237 per square foot. 1705 Bel Aire Ave is a home located in Tulare County with nearby schools including Oak Grove Elementary School, Burton Middle School, and Monache High School.
Ownership History
Date
Name
Owned For
Owner Type
Purchase Details
Closed on
Jul 8, 2011
Sold by
Rubalcava Miguel
Bought by
Rubalcava Miguel and Rubalcava Elvia
Current Estimated Value
Home Financials for this Owner
Home Financials are based on the most recent Mortgage that was taken out on this home.
Original Mortgage
$96,500
Outstanding Balance
$37,525
Interest Rate
4.5%
Mortgage Type
New Conventional
Estimated Equity
$303,856
Purchase Details
Closed on
Jul 14, 2010
Sold by
Rubalcava Elvia
Bought by
Rubalcava Miguel
Home Financials for this Owner
Home Financials are based on the most recent Mortgage that was taken out on this home.
Original Mortgage
$15,000
Interest Rate
4.68%
Mortgage Type
Stand Alone Refi Refinance Of Original Loan
Purchase Details
Closed on
Jul 1, 1998
Sold by
Lowthorp Parthenia C
Bought by
Rubalcava Miguel and Rubalcava Elvia
Home Financials for this Owner
Home Financials are based on the most recent Mortgage that was taken out on this home.
Original Mortgage
$78,834
Interest Rate
6.9%
Mortgage Type
FHA
Create a Home Valuation Report for This Property
The Home Valuation Report is an in-depth analysis detailing your home's value as well as a comparison with similar homes in the area
Home Values in the Area
Average Home Value in this Area
Purchase History
| Date | Buyer | Sale Price | Title Company |
|---|---|---|---|
| Rubalcava Miguel | -- | Fidelity Natl Title Co Of Ca | |
| Rubalcava Miguel | -- | Chicago Title Company | |
| Rubalcava Miguel | $79,000 | Chicago Title Co |
Source: Public Records
Mortgage History
| Date | Status | Borrower | Loan Amount |
|---|---|---|---|
| Open | Rubalcava Miguel | $96,500 | |
| Closed | Rubalcava Miguel | $15,000 | |
| Closed | Rubalcava Miguel | $78,834 |
Source: Public Records
Tax History Compared to Growth
Tax History
| Year | Tax Paid | Tax Assessment Tax Assessment Total Assessment is a certain percentage of the fair market value that is determined by local assessors to be the total taxable value of land and additions on the property. | Land | Improvement |
|---|---|---|---|---|
| 2025 | $1,301 | $123,854 | $28,218 | $95,636 |
| 2024 | $1,301 | $121,426 | $27,665 | $93,761 |
| 2023 | $1,305 | $119,046 | $27,123 | $91,923 |
| 2022 | $1,254 | $116,713 | $26,592 | $90,121 |
| 2021 | $1,235 | $114,425 | $26,071 | $88,354 |
| 2020 | $1,213 | $113,252 | $25,804 | $87,448 |
| 2019 | $1,212 | $111,031 | $25,298 | $85,733 |
| 2018 | $1,158 | $108,854 | $24,802 | $84,052 |
| 2017 | $1,140 | $106,720 | $24,316 | $82,404 |
| 2016 | $1,086 | $104,627 | $23,839 | $80,788 |
| 2015 | $1,072 | $103,055 | $23,481 | $79,574 |
| 2014 | $1,047 | $101,036 | $23,021 | $78,015 |
Source: Public Records
Map
Nearby Homes
- 1691 Terry Ct
- 1644 Mccomb Ave
- 1750 W Terry Cir
- 1041 Greenfield Dr
- 1681 W Wall Ln
- 1690 Memory Ln
- 1730 W Grand Ave
- 1076 N Beverly St
- 1857 W Westfield Ave
- 595 N Salisbury St
- 1121 N Lindale Way
- 1045 N Westside St
- 1771 W Aurora Ct
- 1926 W Nancy Ave
- 1245 Atkins St
- 0 Pioneer Ave Unit 233651
- 700 N Prospect St
- 1370 Lindale Place
- 640 N Prospect St
- 1421 Pamela Cir
- 1715 Bel Aire Ave
- 1695 Bel Aire Ave
- 1700 Theta Ct
- 1710 Theta Ct
- 1690 Theta Ct
- 1725 Bel Aire Ave
- 1685 Bel Aire Ave
- 1708 Bel Aire Ave
- 1720 Theta Ct
- 1680 Theta Ct
- 934 Rose St
- 0 W Henderson Ave (7 39 Acres) Unit 181690
- 934 N Rose St
- 1735 Bel Aire Ave
- 1680 Bel Aire Ave
- 1661 Bel Aire Ave
- 1674 Theta Ct
- 945 Patsy St
- 944 Rose St
- 1701 Theta Ct