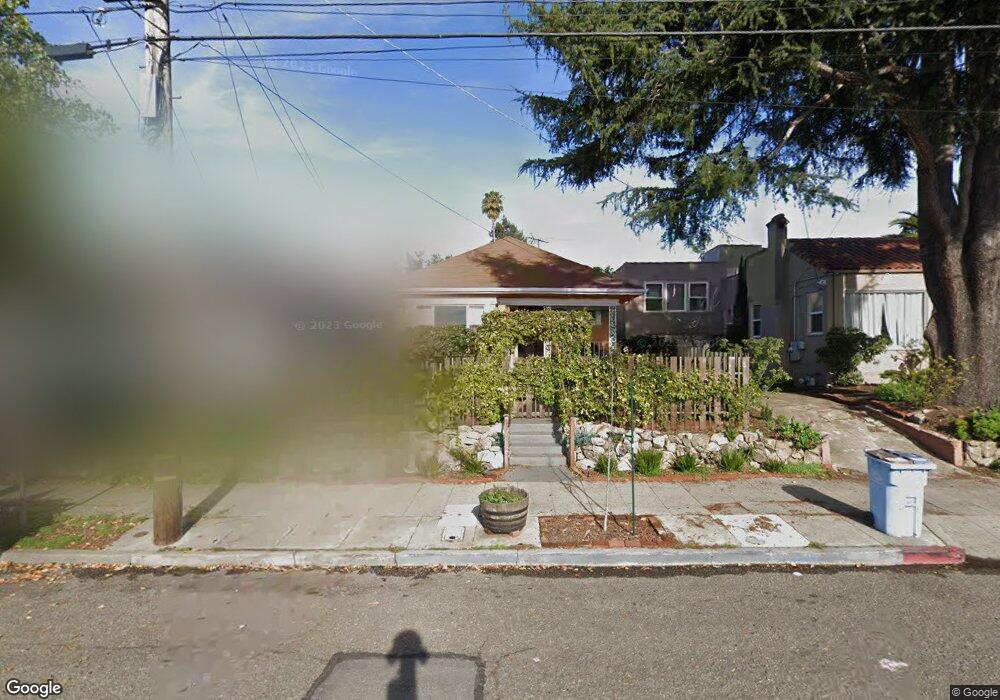
1705 Carleton St Berkeley, CA 94703
South Berkeley NeighborhoodEstimated Value: $985,000 - $1,545,000
3
Beds
2
Baths
1,350
Sq Ft
$940/Sq Ft
Est. Value
About This Home
This home is located at 1705 Carleton St, Berkeley, CA 94703 and is currently estimated at $1,269,282, approximately $940 per square foot. 1705 Carleton St is a home located in Alameda County with nearby schools including Malcolm X Elementary School, Emerson Elementary School, and John Muir Elementary School.
Ownership History
Date
Name
Owned For
Owner Type
Purchase Details
Closed on
Aug 20, 2021
Sold by
Schlags Jeffrey B and Schlags Karla C
Bought by
Schlags Jeffrey Barney and Schlags Karla Crowley
Current Estimated Value
Purchase Details
Closed on
Mar 26, 2020
Sold by
Schlags Kathleen
Bought by
Schlags Jeffrey B and Schlags Karla C
Home Financials for this Owner
Home Financials are based on the most recent Mortgage that was taken out on this home.
Original Mortgage
$454,500
Outstanding Balance
$402,632
Interest Rate
3.4%
Mortgage Type
New Conventional
Estimated Equity
$866,650
Purchase Details
Closed on
Apr 24, 2014
Sold by
Davis Lee Arthur and Davis Janice Deloris
Bought by
Schlags Jeffrey B and Schlags Karla C
Home Financials for this Owner
Home Financials are based on the most recent Mortgage that was taken out on this home.
Original Mortgage
$468,000
Interest Rate
3.37%
Mortgage Type
Adjustable Rate Mortgage/ARM
Create a Home Valuation Report for This Property
The Home Valuation Report is an in-depth analysis detailing your home's value as well as a comparison with similar homes in the area
Home Values in the Area
Average Home Value in this Area
Purchase History
| Date | Buyer | Sale Price | Title Company |
|---|---|---|---|
| Schlags Jeffrey Barney | -- | None Available | |
| Schlags Jeffrey B | -- | First American Title Company | |
| Schlags Jeffrey B | $585,000 | Old Republic Title Company |
Source: Public Records
Mortgage History
| Date | Status | Borrower | Loan Amount |
|---|---|---|---|
| Open | Schlags Jeffrey B | $454,500 | |
| Closed | Schlags Jeffrey B | $468,000 |
Source: Public Records
Tax History
| Year | Tax Paid | Tax Assessment Tax Assessment Total Assessment is a certain percentage of the fair market value that is determined by local assessors to be the total taxable value of land and additions on the property. | Land | Improvement |
|---|---|---|---|---|
| 2025 | $11,347 | $710,098 | $215,129 | $501,969 |
| 2024 | $11,347 | $696,040 | $210,912 | $492,128 |
| 2023 | $11,054 | $689,258 | $206,777 | $482,481 |
| 2022 | $10,800 | $668,744 | $202,723 | $473,021 |
| 2021 | $10,826 | $655,500 | $198,750 | $463,750 |
| 2020 | $10,297 | $655,708 | $196,712 | $458,996 |
| 2019 | $9,936 | $642,855 | $192,856 | $449,999 |
| 2018 | $9,762 | $630,254 | $189,076 | $441,178 |
| 2017 | $9,411 | $617,900 | $185,370 | $432,530 |
| 2016 | $9,123 | $605,784 | $181,735 | $424,049 |
| 2015 | $8,996 | $596,687 | $179,006 | $417,681 |
| 2014 | $2,236 | $39,801 | $23,401 | $16,400 |
Source: Public Records
Map
Nearby Homes
- 1726 Parker St Unit 2
- 1726 Parker St Unit 1
- 1634 Blake St
- 1612 Parker St
- 2533 Grant St
- 2701 Grant St
- 1819 Carleton St
- 1604 Dwight Way
- 1524 Blake St
- 1901 Parker St Unit 3
- 1515 Derby St
- 1516 Blake St
- 1516 Blake St Unit A
- 2829 California St
- 2750 Sacramento St
- 1450 Ward St
- 2758 Sacramento St
- 2774 Sacramento St
- 2782 Sacramento St
- 2790 Sacramento St
- 1701 Carleton St
- 1709 Carleton St
- 2609 McGee Ave Unit B
- 2609 McGee Ave
- 1715 Carleton St
- 1647 Carleton St
- 2614 McGee Ave
- 1708 Parker St
- 1717 Carleton St
- 2610 McGee Ave
- 1706 Parker St
- 1641 Carleton St
- 1700 Parker St
- 1710 Parker St
- 1714 Parker St
- 2608 McGee Ave
- 1646 Carleton St
- 2606 McGee Ave
- 1639 Carleton St
- 1716 Parker St
Your Personal Tour Guide
Ask me questions while you tour the home.