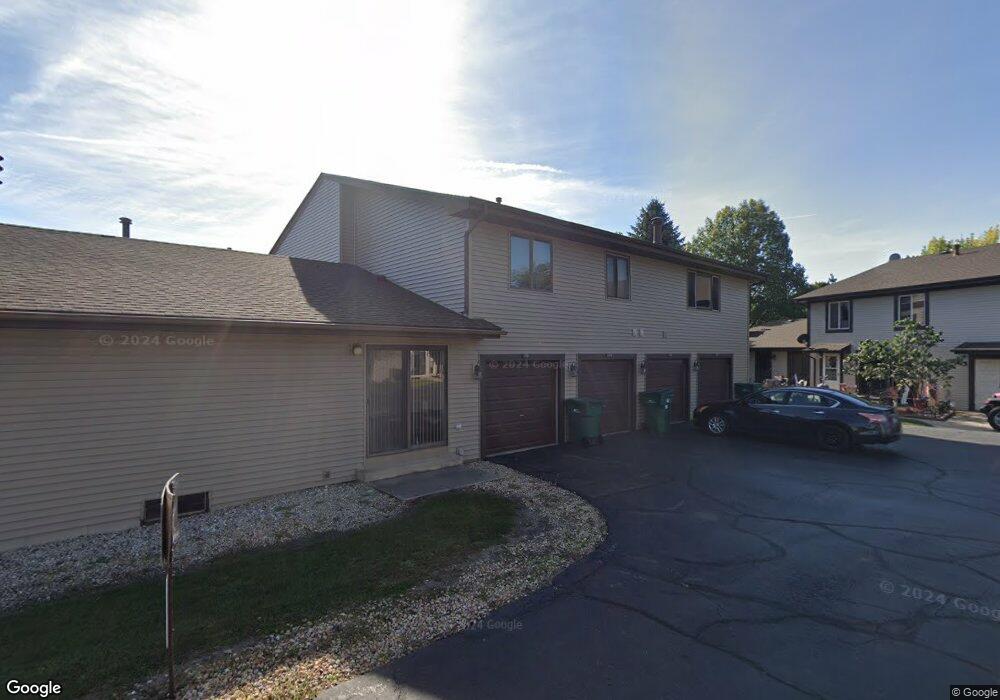
1705 Cedarbrook Ct Unit 113 Sycamore, IL 60178
Estimated Value: $189,455 - $198,000
3
Beds
2
Baths
692
Sq Ft
$278/Sq Ft
Est. Value
About This Home
This home is located at 1705 Cedarbrook Ct Unit 113, Sycamore, IL 60178 and is currently estimated at $192,364, approximately $277 per square foot. 1705 Cedarbrook Ct Unit 113 is a home located in DeKalb County with nearby schools including Sycamore High School, Cornerstone Christian Academy, and St Mary's Catholic School.
Ownership History
Date
Name
Owned For
Owner Type
Purchase Details
Closed on
Apr 12, 2019
Sold by
Treadwell Brad
Bought by
Geisen Scott
Current Estimated Value
Home Financials for this Owner
Home Financials are based on the most recent Mortgage that was taken out on this home.
Original Mortgage
$82,500
Outstanding Balance
$72,532
Interest Rate
4.3%
Mortgage Type
New Conventional
Estimated Equity
$119,832
Purchase Details
Closed on
Jul 19, 2016
Sold by
Hud
Bought by
Treadwell Brad
Home Financials for this Owner
Home Financials are based on the most recent Mortgage that was taken out on this home.
Original Mortgage
$55,500
Interest Rate
3.6%
Mortgage Type
Stand Alone First
Purchase Details
Closed on
Feb 22, 2016
Sold by
Dekalb County Sheriff
Bought by
Hud
Create a Home Valuation Report for This Property
The Home Valuation Report is an in-depth analysis detailing your home's value as well as a comparison with similar homes in the area
Home Values in the Area
Average Home Value in this Area
Purchase History
| Date | Buyer | Sale Price | Title Company |
|---|---|---|---|
| Geisen Scott | $110,000 | None Available | |
| Treadwell Brad | -- | Fox Title | |
| Hud | -- | -- |
Source: Public Records
Mortgage History
| Date | Status | Borrower | Loan Amount |
|---|---|---|---|
| Open | Geisen Scott | $82,500 | |
| Previous Owner | Treadwell Brad | $55,500 |
Source: Public Records
Tax History Compared to Growth
Tax History
| Year | Tax Paid | Tax Assessment Tax Assessment Total Assessment is a certain percentage of the fair market value that is determined by local assessors to be the total taxable value of land and additions on the property. | Land | Improvement |
|---|---|---|---|---|
| 2024 | $4,211 | $50,522 | $5,961 | $44,561 |
| 2023 | $4,211 | $47,156 | $5,577 | $41,579 |
| 2022 | $4,209 | $45,005 | $5,323 | $39,682 |
| 2021 | $3,779 | $39,680 | $5,068 | $34,612 |
| 2020 | $3,459 | $35,856 | $4,910 | $30,946 |
| 2019 | $3,249 | $33,388 | $4,704 | $28,684 |
| 2018 | $3,128 | $31,576 | $4,449 | $27,127 |
| 2017 | $3,036 | $30,061 | $4,236 | $25,825 |
| 2016 | $2,931 | $28,253 | $3,981 | $24,272 |
| 2015 | -- | $26,531 | $3,738 | $22,793 |
| 2014 | -- | $25,535 | $3,598 | $21,937 |
| 2013 | -- | $26,461 | $3,728 | $22,733 |
Source: Public Records
Map
Nearby Homes
- 1715 Cedarbrook Ct Unit 24
- 1729 Raintree Ct Unit 92
- Lots 1 & 2 Dekalb Ave
- 1618 Pebblewood Dr
- 1229 Bristol Dr W
- 1331 Yorkshire Dr N
- Lots 700-900 Ridge Dr
- 1329 Foxbend Dr
- 0000 Coltonville Rd
- 966 Constance Ln
- 1123 Milan Dr N
- 2222 Coltonville Rd
- 631 Anjali Ct Unit R
- 624 Anjali Ct Unit L
- 625 Anjali Ct Unit L
- 617 Anjali Ct
- 1456 Adrienne Cir
- 547 Anjali Ct Unit L
- 545 Anjali Ct Unit R
- 539 Anjali Ct
- 1705 Cedarbrook Ct Unit 1
- 1703 Cedarbrook Ct Unit 112
- 1716 Cedarbrook Ct Unit 141
- 1718 Cedarbrook Ct Unit 142
- 1701 Cedarbrook Ct Unit 111
- 1720 Cedarbrook Ct Unit 143
- 1722 Cedarbrook Ct Unit 144
- 1724 Cedarbrook Ct Unit 131
- 1726 Cedarbrook Ct Unit 132
- 1728 Cedarbrook Ct Unit 133
- 1730 Cedarbrook Ct Unit 134
- 1730 Cedarbrook Ct Unit 1
- 1625 Woodgate Dr
- 1731 Cedarbrook Ct Unit 14
- 1729 Cedarbrook Ct Unit 13
- 1727 Cedarbrook Ct Unit 12
- 1723 Cedarbrook Ct Unit 124
- 1721 Cedarbrook Ct Unit 123
- 1721 Cedarbrook Ct Unit 1
- 1719 Cedarbrook Ct Unit 122