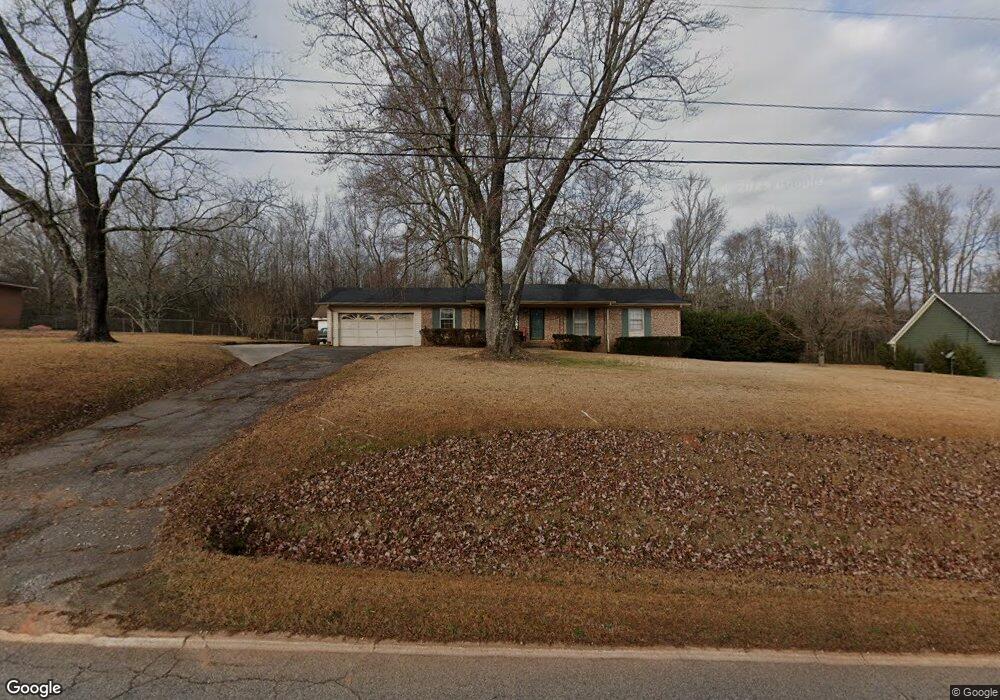
1705 Ethridge Mill Rd Unit 1705/1647 Griffin, GA 30224
Spalding County NeighborhoodEstimated Value: $177,000 - $242,000
3
Beds
2
Baths
1,350
Sq Ft
$160/Sq Ft
Est. Value
About This Home
This home is located at 1705 Ethridge Mill Rd Unit 1705/1647, Griffin, GA 30224 and is currently estimated at $216,037, approximately $160 per square foot. 1705 Ethridge Mill Rd Unit 1705/1647 is a home located in Spalding County with nearby schools including Crescent Road Elementary School, Rehoboth Road Middle School, and Spalding High School.
Ownership History
Date
Name
Owned For
Owner Type
Purchase Details
Closed on
Nov 22, 2017
Sold by
Mitchell Donna L
Bought by
Jones Bobby T
Current Estimated Value
Purchase Details
Closed on
Jun 23, 2017
Sold by
Moore Richard Max
Bought by
Jones Bobby T
Home Financials for this Owner
Home Financials are based on the most recent Mortgage that was taken out on this home.
Original Mortgage
$88,369
Interest Rate
4.4%
Mortgage Type
FHA
Purchase Details
Closed on
Aug 27, 1991
Sold by
Smith Phillip A and Smith Sandra S
Bought by
Moore Richard M
Purchase Details
Closed on
Apr 4, 1969
Sold by
Bolkcom Milton G
Bought by
Smith Phillip A and Smith Sandra S
Purchase Details
Closed on
Jan 5, 1968
Sold by
Williams C E
Bought by
Bolkcom Milton G
Purchase Details
Closed on
Mar 25, 1952
Bought by
Williams C E
Create a Home Valuation Report for This Property
The Home Valuation Report is an in-depth analysis detailing your home's value as well as a comparison with similar homes in the area
Home Values in the Area
Average Home Value in this Area
Purchase History
| Date | Buyer | Sale Price | Title Company |
|---|---|---|---|
| Jones Bobby T | -- | -- | |
| Jones Bobby T | $90,000 | -- | |
| Jones Bobby T | -- | -- | |
| Moore Melissa | -- | -- | |
| Jones Bobby T | -- | -- | |
| Moore Richard M | $73,000 | -- | |
| Smith Phillip A | $3,500 | -- | |
| Bolkcom Milton G | -- | -- | |
| Williams C E | -- | -- |
Source: Public Records
Mortgage History
| Date | Status | Borrower | Loan Amount |
|---|---|---|---|
| Previous Owner | Moore Melissa | $88,369 |
Source: Public Records
Tax History Compared to Growth
Tax History
| Year | Tax Paid | Tax Assessment Tax Assessment Total Assessment is a certain percentage of the fair market value that is determined by local assessors to be the total taxable value of land and additions on the property. | Land | Improvement |
|---|---|---|---|---|
| 2024 | $2,292 | $65,888 | $5,861 | $60,027 |
| 2023 | $2,292 | $65,888 | $5,861 | $60,027 |
| 2022 | $2,148 | $60,871 | $5,069 | $55,802 |
| 2021 | $1,721 | $49,128 | $5,069 | $44,059 |
| 2020 | $1,295 | $37,302 | $5,069 | $32,233 |
| 2019 | $1,104 | $31,471 | $5,069 | $26,402 |
| 2018 | $1,022 | $28,551 | $3,917 | $24,634 |
| 2017 | $1,061 | $28,551 | $3,917 | $24,634 |
| 2016 | $552 | $28,550 | $3,917 | $24,634 |
| 2015 | $576 | $28,550 | $3,917 | $24,634 |
| 2014 | $583 | $28,550 | $3,917 | $24,634 |
Source: Public Records
Map
Nearby Homes
- 1215 White Oak Way
- 138 Townsend Ct
- 119 Townsend Ct
- 135 Townsend Ct
- 137 Townsend Dr
- 1317 Sycamore Cir
- 1117 Birchwood Dr
- 1200 White Oak Way
- 1132 Birchwood Dr
- 490 County Line Rd
- 2105 Honeybee Creek Dr
- TRACT D Cedardale Drive Sweetbriar Ln
- 2203 Honeybee Creek Dr
- 1 Sweetbriar Ln Unit A
- 21 Oak Grove Trail
- 0 Cedardale Dr Unit 10272855
- 0 Oak Grove Trial
- 36 Laurelwood Cir
- 7 Crabapple Cir
- 116 Southbrook Dr
- 1705 Ethridge Mill Rd Unit 1705
- 1705 Ethridge Mill Rd
- 1707 Ethridge Mill Rd
- 1647 Ethridge Mill Rd
- 1708 Ethridge Mill Rd
- 1709 Ethridge Mill Rd
- 1704 Ethridge Mill Rd
- 1645 Ethridge Mill Rd
- 1714 Ethridge Mill Rd
- 1643 Ethridge Mill Rd
- 1719 Ethridge Mill Rd
- 1725 Ethridge Mill Rd
- 1724 Ethridge Mill Rd
- 1730 Ethridge Mill Rd
- 1735 Ethridge Mill Rd
- 1210 White Oak Way
- 1615 Ethridge Mill Rd
- 1739 Ethridge Mill Rd
- 1526 Ethridge Mill Rd
- 1208 White Oak Way Unit 21 undeveloped lots