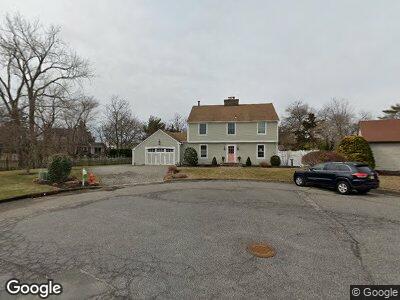
1705 Howe Ct Point Pleasant Boro, NJ 08742
Estimated Value: $1,091,298 - $1,539,000
3
Beds
3
Baths
2,228
Sq Ft
$561/Sq Ft
Est. Value
About This Home
This home is located at 1705 Howe Ct, Point Pleasant Boro, NJ 08742 and is currently estimated at $1,250,075, approximately $561 per square foot. 1705 Howe Ct is a home located in Ocean County with nearby schools including Point Pleasant High School and St. Peter School.
Ownership History
Date
Name
Owned For
Owner Type
Purchase Details
Closed on
Nov 29, 2011
Sold by
Ruggiero Robert and Devine Ann B
Bought by
Niebling Walter and Niebling Elizabeth
Current Estimated Value
Home Financials for this Owner
Home Financials are based on the most recent Mortgage that was taken out on this home.
Original Mortgage
$375,000
Interest Rate
4.1%
Mortgage Type
New Conventional
Purchase Details
Closed on
Oct 1, 2002
Sold by
West Judith
Bought by
Ruggiero Robert and Devine Anne
Home Financials for this Owner
Home Financials are based on the most recent Mortgage that was taken out on this home.
Original Mortgage
$400,000
Interest Rate
6.24%
Purchase Details
Closed on
Sep 9, 1993
Sold by
Kunkel Joseph F
Bought by
West Robert B and West Judith
Create a Home Valuation Report for This Property
The Home Valuation Report is an in-depth analysis detailing your home's value as well as a comparison with similar homes in the area
Home Values in the Area
Average Home Value in this Area
Purchase History
| Date | Buyer | Sale Price | Title Company |
|---|---|---|---|
| Niebling Walter | $625,000 | Old Republic National Title | |
| Ruggiero Robert | $630,000 | -- | |
| West Robert B | $239,000 | -- |
Source: Public Records
Mortgage History
| Date | Status | Borrower | Loan Amount |
|---|---|---|---|
| Open | Niebling Walter L | $50,000 | |
| Open | Niebling Walter L | $359,000 | |
| Closed | Niebling Walter | $375,000 | |
| Previous Owner | Ruggiero Robert | $150,000 | |
| Previous Owner | Ruggiero Robert | $379,101 | |
| Previous Owner | Ruggiero Robert | $400,000 |
Source: Public Records
Tax History Compared to Growth
Tax History
| Year | Tax Paid | Tax Assessment Tax Assessment Total Assessment is a certain percentage of the fair market value that is determined by local assessors to be the total taxable value of land and additions on the property. | Land | Improvement |
|---|---|---|---|---|
| 2024 | $11,310 | $517,400 | $239,300 | $278,100 |
| 2023 | $11,078 | $517,400 | $239,300 | $278,100 |
| 2022 | $11,078 | $517,400 | $239,300 | $278,100 |
| 2021 | $10,907 | $517,400 | $239,300 | $278,100 |
| 2020 | $10,793 | $517,400 | $239,300 | $278,100 |
| 2019 | $10,648 | $517,400 | $239,300 | $278,100 |
| 2018 | $10,332 | $517,400 | $239,300 | $278,100 |
| 2017 | $10,105 | $517,400 | $239,300 | $278,100 |
| 2016 | $10,027 | $517,400 | $239,300 | $278,100 |
| 2015 | $9,908 | $517,400 | $239,300 | $278,100 |
| 2014 | $9,681 | $517,400 | $239,300 | $278,100 |
Source: Public Records
Map
Nearby Homes
- 717 Mount Place
- 162 Park Ave
- 1401 Rue Mirador
- 463 Lake Ave
- 1709 Certainty Dr
- 50 Bridge Ave
- 1848 Northwest Dr
- 1320 Bay Ave
- 630 Main Ave
- 21 Mount St Unit C1
- 551 East Ave
- 525 East Ave
- 2 Mount St
- 409 East Ave
- 22 Cedar Dr
- 1501 Hulse Rd Unit 18
- 1320 Charles St
- 104 Osborne Ave
- 2126 Barnegat Blvd
- 310 Maryland Ave Unit 24
- 1705 Howe Ct
- 1703 Howe Ct
- 209 Meadow Ave
- 211 Meadow Ave
- 1704 Howe Ct
- 215 Meadow Ave
- 215 Meadow Ave Unit Summer Rental
- 1702 Howe Ct
- 203 Meadow Ave
- 206 Howe St
- 201 Meadow Ave
- 210 Howe St
- 200 Howe St
- 212 Howe St
- 1712 Bay Ave
- 1712 Bay Ave Unit UP
- 214 Howe St
- 208 Howe St Unit 210
- 1710 Bay Ave
- 216 Howe St