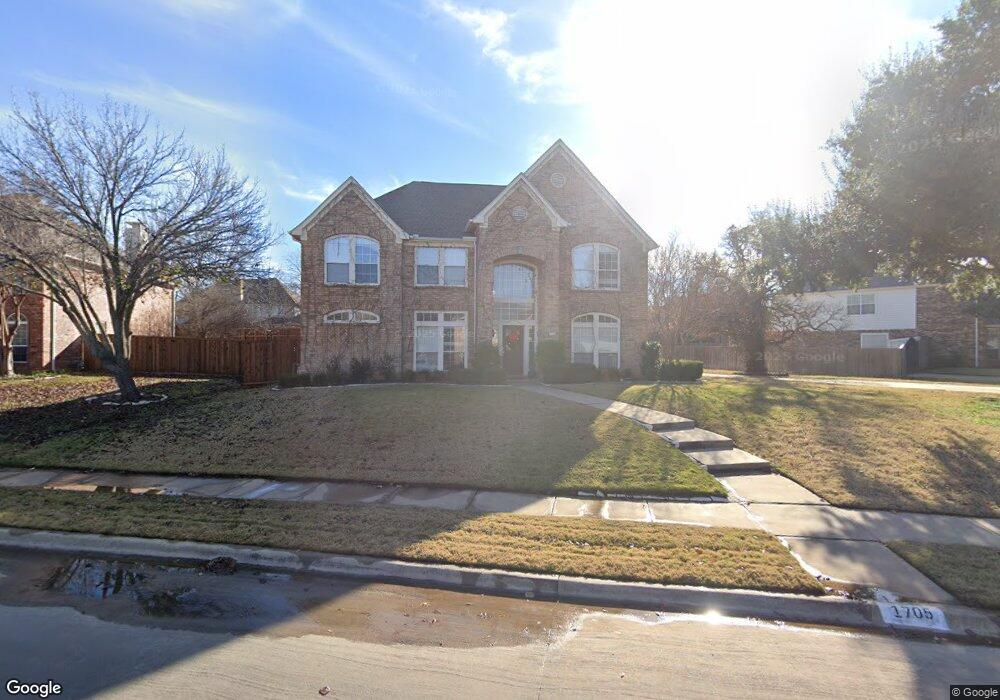
1705 Redwing Dr Southlake, TX 76092
Estimated Value: $979,000 - $1,086,000
5
Beds
3
Baths
3,727
Sq Ft
$277/Sq Ft
Est. Value
About This Home
This home is located at 1705 Redwing Dr, Southlake, TX 76092 and is currently estimated at $1,032,182, approximately $276 per square foot. 1705 Redwing Dr is a home located in Tarrant County with nearby schools including Carroll Elementary School, Don T. Durham Intermediate School, and Carroll Middle School.
Ownership History
Date
Name
Owned For
Owner Type
Purchase Details
Closed on
Mar 29, 2004
Sold by
Weitkamp Robert D and Weitkamp Christa L
Bought by
Scandura Judith
Current Estimated Value
Home Financials for this Owner
Home Financials are based on the most recent Mortgage that was taken out on this home.
Original Mortgage
$190,000
Outstanding Balance
$88,975
Interest Rate
5.59%
Mortgage Type
Purchase Money Mortgage
Estimated Equity
$943,207
Purchase Details
Closed on
Dec 27, 1999
Sold by
Weitkamp Robert D and Weitkamp Christa L
Bought by
Weitkamp Robert D and Weitkamp Christa L
Purchase Details
Closed on
Jul 29, 1998
Sold by
Perry Homes
Bought by
Weitkamp Robert D and Weitkamp Christa L
Home Financials for this Owner
Home Financials are based on the most recent Mortgage that was taken out on this home.
Original Mortgage
$202,870
Interest Rate
6.94%
Create a Home Valuation Report for This Property
The Home Valuation Report is an in-depth analysis detailing your home's value as well as a comparison with similar homes in the area
Home Values in the Area
Average Home Value in this Area
Purchase History
| Date | Buyer | Sale Price | Title Company |
|---|---|---|---|
| Scandura Judith | -- | Hexter Fair Southlake | |
| Weitkamp Robert D | -- | -- | |
| Weitkamp Robert D | -- | Rattikin Title Co |
Source: Public Records
Mortgage History
| Date | Status | Borrower | Loan Amount |
|---|---|---|---|
| Open | Scandura Judith | $190,000 | |
| Previous Owner | Weitkamp Robert D | $202,870 |
Source: Public Records
Tax History Compared to Growth
Tax History
| Year | Tax Paid | Tax Assessment Tax Assessment Total Assessment is a certain percentage of the fair market value that is determined by local assessors to be the total taxable value of land and additions on the property. | Land | Improvement |
|---|---|---|---|---|
| 2025 | $12,006 | $860,000 | $275,475 | $584,525 |
| 2024 | $12,006 | $860,000 | $275,475 | $584,525 |
| 2023 | $15,472 | $848,863 | $275,475 | $573,388 |
| 2022 | $15,401 | $713,871 | $183,650 | $530,221 |
| 2021 | $14,816 | $649,811 | $183,650 | $466,161 |
| 2020 | $12,642 | $550,000 | $165,285 | $384,715 |
| 2019 | $12,834 | $530,000 | $120,000 | $410,000 |
| 2018 | $12,664 | $522,972 | $120,000 | $402,972 |
| 2017 | $13,255 | $534,774 | $100,000 | $434,774 |
| 2016 | $12,049 | $486,114 | $100,000 | $386,114 |
| 2015 | $10,752 | $429,500 | $55,000 | $374,500 |
| 2014 | $10,752 | $429,500 | $55,000 | $374,500 |
Source: Public Records
Map
Nearby Homes
- 207 Killdeer Trail
- 1712 Wild Rose Way
- 203 Donley Ct
- 2530 & 2580 W Southlake Blvd
- 1811 Redwing Ct
- 2116 Camden Cir
- 205 Lovegrass Ln
- 1807 Mesquite Ct
- 1340 Meadow Glen
- 550 N Peytonville Ave
- 204 Southridge Lakes Pkwy
- 904 Palos Verdes Trail
- 503 Indian Paintbrush Way
- 2304 Top Rail Ln
- 203 Manor Place
- 1371 Holland Hill
- 2009 Montecito Trail
- 275 Timberline Ln
- 403 Presidio Ct
- 2415 Poplar Ct
- 1703 Water Lily Dr
- 1701 Redwing Dr
- 1702 Egret Ln
- 1705 Water Lily Dr
- 1700 Egret Ln
- 302 Quail Ct
- 1706 Redwing Dr
- 1700 Water Lily Dr
- 1704 Egret Ln
- 1707 Water Lily Dr
- 211 Killdeer Trail
- 1708 Redwing Dr
- 1702 Water Lily Dr
- 301 Quail Ct
- 209 Killdeer Trail
- 1706 Egret Ln
- 304 Quail Ct
- 303 Quail Ct
- 1701 Mesquite Rd
- 1704 Water Lily Dr